A slow website costs you visitors, enquiries and search rankings, and the fix depends entirely on where the time is going. This guide gives you a diagnosis order that works: measure first, then check the server side, then the page itself, and only then decide whether you need a bigger plan.
Start by measuring. Run your page through PageSpeed Insights or WebPageTest and look at the time to first byte (TTFB): if the server takes more than about a second to start answering, the problem is on the server side (PHP, the database, plugins, slow external calls or your account's resource limits). If the first byte is quick but the page still loads slowly, the problem is the page itself (images, scripts, no caching). Fix the cause you find, and upgrade your plan only when your resource usage shows you are genuinely hitting limits after optimising.
1. Measure before you change anything
Guessing wastes time. A few minutes of measurement tells you which half of the problem to work on, and gives you a "before" number to compare against.
Test the page that is actually slow, not only your home page. A shop's checkout or a search page often behaves very differently from a cached home page. Run each test two or three times, because the first load after a quiet period is often slower than the rest.
The three Core Web Vitals Google uses are Largest Contentful Paint (how fast the main content appears; aim for 2.5 seconds or less), Interaction to Next Paint (how quickly the page reacts to a tap or click; aim for 200 ms or less) and Cumulative Layout Shift (how much the page jumps around while loading; aim for 0.1 or less).
2. Read the result: slow server or heavy page?
The single most useful number is TTFB, the time from the browser asking for the page to the first byte of the reply arriving. It covers the network trip plus everything the server does to build the page: running PHP, querying the database, calling other services.
| What you see | Likely cause | Where to look |
|---|---|---|
| Slow TTFB (over about 1 second) on every page | Server-side work: PHP, database, plugins, resource limits | Sections 3 to 6 |
| Slow TTFB only on some pages | One slow query, plugin or external call on those pages | Sections 5 and 6 |
| Fast TTFB, slow full load | Page weight: large images, many scripts, no caching | Section 7 |
| Slow only for some visitors or places | Their network, or distance from the server | Section 8 |
| Occasional errors plus slowness | Resource limits being hit | Section 3 |
Developers can check TTFB from a terminal with curl:
curl -o /dev/null -s -w 'TTFB: %{time_starttransfer}s Total: %{time_total}s\n' https://yourdomain.com/Run it a few times. If TTFB is consistently high for a simple page, the server is doing too much work for each visit.
3. Check your account's resource limits
Domain India cPanel and DirectAdmin hosting runs on CloudLinux (measured on our servers, 20 September 2026); Webuzo hosting doesn't, so the limits below apply to cPanel and DirectAdmin. CloudLinux gives every account its own share of CPU, memory, disk I/O and simultaneous PHP processes (entry processes), so one busy site cannot slow its neighbours down. The trade-off is that when your own site needs more than its share, it is slowed down or refused.
Signs you are hitting a limit:
- pages slow down sharply at busy times, then recover;
- visitors see a "Resource Limit Is Reached" (508) or 503 error;
- the admin area of your CMS times out while the public site still loads.
In cPanel, open Metrics › Resource Usage to see CPU, memory, I/O and entry processes over time. The faults column shows when your account hit a limit. On other control panels, look for the resource usage page, or ask support to check it for you.
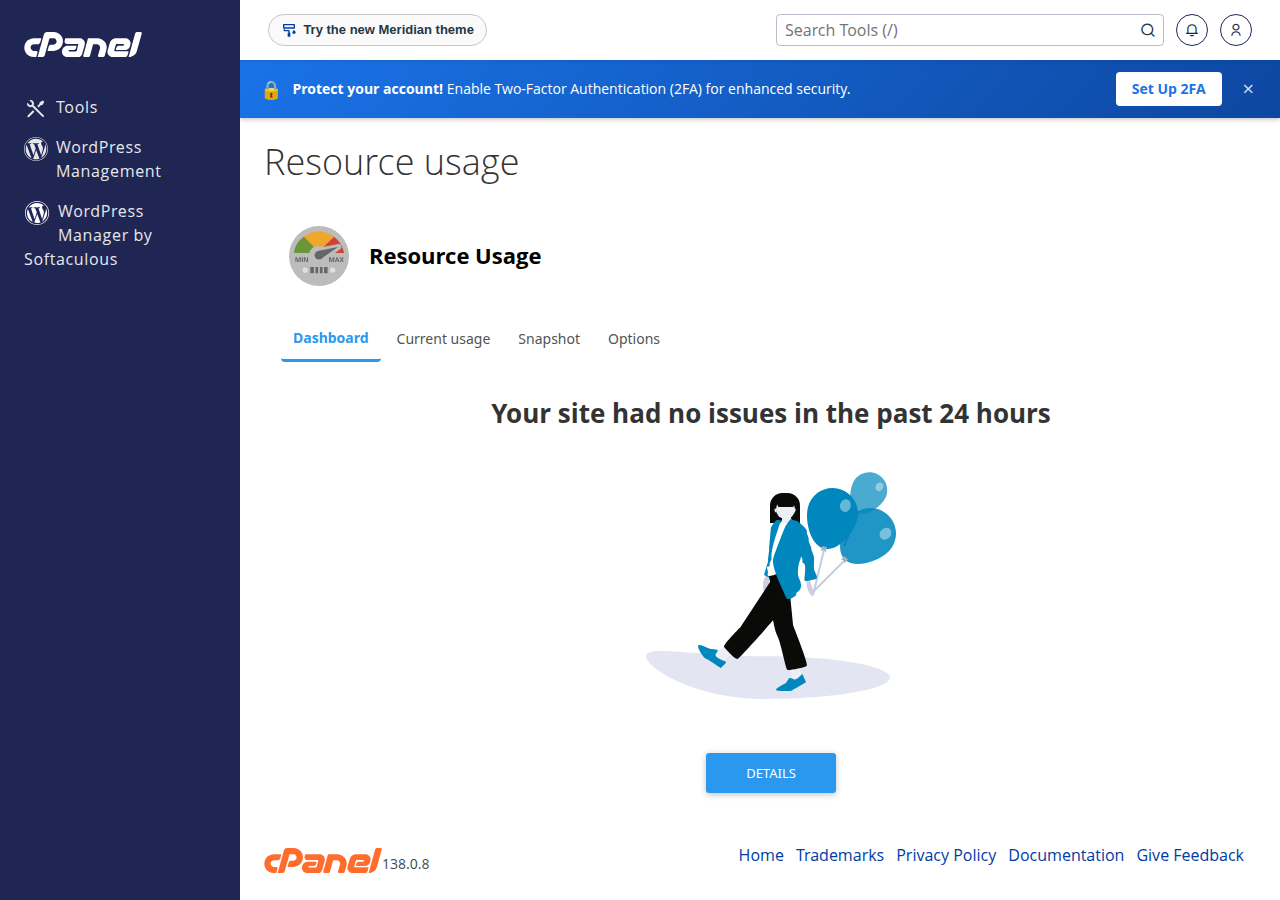
When faults appear while CPU and memory use stay low, the usual cause is PHP processes sitting and waiting, often for a slow outside service (see section 6). Raising the limit then just lets more requests queue up. Find what the processes are waiting for first.
For the error itself, see Understanding and troubleshooting the "Resource Limit Is Reached" error, and for WordPress specifically, How to debug and fix "Resource Limit Is Reached" errors on your WordPress site.
4. Check your PHP version and OPcache
PHP version. Newer PHP releases are much faster than old ones, and the old ones no longer get security fixes. Our cPanel servers offer every PHP version from 5.1 to 8.5, selectable per account (measured 20 September 2026), so a site can easily be left on an old version for years. Choose the newest supported PHP 8 version your site and plugins are compatible with, then test the site. In cPanel this is MultiPHP Manager: see How to change PHP versions in cPanel using MultiPHP Manager. For other panels, see How to change your PHP version.
A very old theme or plugin can break on a newer PHP version. Take a backup first, switch, then check your key pages, forms and checkout. If something breaks, switch back and update the theme or plugin.
OPcache. OPcache keeps compiled PHP code in memory so it doesn't have to be compiled again on every visit. It is enabled on our cPanel servers. A phpinfo() page will not work there, because that function is disabled. To confirm OPcache for your own PHP version, upload a short test file that prints ini_get('opcache.enable'), open it once, then delete it; the PHP OPcache guide has the details. To view or change your PHP settings, use cPanel's MultiPHP INI Editor.
Memory errors. If your logs show "Allowed memory size exhausted", the page is failing rather than just slow. See How to fix "Allowed memory size exhausted" PHP errors.
5. Find slow database queries and heavy plugins
On WordPress, WooCommerce and most PHP applications, most of the server time goes on database queries and on the code that plugins add to every page.
Heavy plugins. Every active plugin runs on every page load, and some run far more work than they need to. Common offenders are page builders loading on every page, "related posts" plugins, statistics and visitor-logging plugins that write to the database on every visit, broken-link checkers, and security plugins that scan on each request. To find them:
- Measure a baseline.Note the TTFB of a slow page.
- Install Query Monitor.This free WordPress plugin shows the slowest database queries and which plugin made them, for any page you load while logged in as an administrator.
- Deactivate suspects one at a time.Re-test after each one. When TTFB drops, you have found a culprit. Do this on a staging copy or at a quiet time.
- Replace or remove it.Look for a lighter plugin, or ask whether you need the feature at all. Remove plugins you have deactivated rather than leaving them installed.
Slow queries. A table without the right index, a bloated WordPress wp_options table full of autoloaded data, or years of post revisions and expired transients can all make queries slow. Clean these up with care and a fresh backup. For a full walk-through, see MySQL performance optimisation: diagnosing and fixing slow queries.
Background jobs. Imports, exports, backups made by a plugin and WordPress's own scheduled tasks all compete with your visitors. Run large jobs at quiet times.
6. Check external calls without timeouts
This is a cause we have found behind sites that are slow or throw "Resource Limit Is Reached" while the account's CPU is barely used.
Many sites call other services while building a page: a payment gateway checking an order's status, a shipping or SMS API, a currency-rate feed, a social media widget, a licence check for a premium plugin. If that service is slow or down, and the code has no timeout, the PHP process waits for it. Each waiting visit holds one of your account's PHP processes. A handful of those and new visitors queue behind them, so the whole site looks down even though your server is idle.
What to do:
- Set a timeout on every outbound call. In PHP's cURL, set both
CURLOPT_CONNECTTIMEOUTandCURLOPT_TIMEOUTto a few seconds. A value of0means "wait forever". In WordPress, pass atimeouttowp_remote_get()andwp_remote_post(). - Don't call a slow service in a loop. Checking the status of every pending order, one by one, on a page load multiplies the wait. Move that work to a scheduled job.
- Cache the answer. A rate or feed that changes once an hour doesn't need to be fetched on every visit.
- Check the pattern. If several sites using the same plugin or gateway slow down at the same moment, the outside service is the likely cause, not your hosting.
Developers can search a site's code for cURL timeouts with:
grep -rnoE "CURLOPT_(CONNECT)?TIMEOUT[^,)]*" ~/public_htmlSome PHP functions used for network connections are disabled on shared hosting for security, which can also make a plugin fail or hang. See PHP disabled functions on shared hosting.
7. Make the page lighter
Once the server answers quickly, the rest of the load time is the browser downloading and drawing the page.
For a full Cloudflare walk-through, see Cloudflare for Indian websites. Only one page-caching plugin should be active at a time; two caching plugins fighting each other often make a site slower or break it.
8. Rule out network and DNS problems
If the site is fast for you but slow for one customer, or slow from one city or network, the delay may be outside your hosting:
- ask the person to try another network, such as mobile data instead of office Wi-Fi;
- run
traceroute yourdomain.com(ortracerton Windows), ormtron Linux and macOS, to see where along the route the delay appears; - test from several locations with WebPageTest to see whether distance is the issue. A CDN helps visitors far from the server.
DNS rarely makes a site slow once it has resolved, but a domain pointing at old or wrong records can make it look broken. If you are changing where your domain points, follow How to change your domain's DNS settings.
9. When to upgrade, and where Domain India plans fit
Upgrade when your Resource Usage page shows regular faults after you have fixed slow plugins, queries and external calls, or when the site's traffic has genuinely grown. Upgrading a site with an unbounded external call just lets it wait on more requests.
A bigger shared plan suits a site that has grown into more websites, mailboxes or storage. You can upgrade an active cPanel or DirectAdmin plan at any time from Hosting › My hosting in the client area and pay only the difference for the rest of your term: see Can I upgrade my web hosting package at any time?
A VPS gives you dedicated vCPU and RAM and full root access, so you can tune the web server, PHP and database yourself. It suits busy shops, custom applications, and anything that needs software or PHP functions that shared hosting doesn't allow. Domain India VPS plans start at 1 vCPU and 2 GB RAM (VPS Starter), and VPS Basic has 2 vCPU and 4 GB RAM.
Domain India list prices exclude 18% GST. For every plan and its live price, see cPanel hosting, DirectAdmin hosting, VPS servers or compare everything on Plans.
10. What to send support
If you have worked through the steps above, or you want us to look, a detailed ticket gets you to an answer much faster. Include:
Support is available on 24/7 live chat, and tickets get a first response within 15 minutes; how long a fix takes depends on the issue. We do not offer phone support. Open a ticket at /support/ticket, or from the client area at New ticket.
Why is my website slow?
Usually for one of two reasons: the server is taking too long to build the page (slow PHP, database queries, heavy plugins, external calls without timeouts, or hitting your account's resource limits), or the page itself is too heavy (large images, many scripts, no caching). Measuring the time to first byte (TTFB) with PageSpeed Insights or WebPageTest tells you which one it is.
What is a good time to first byte?
Google's guidance treats a TTFB of 0.8 seconds or less as good. If your TTFB is consistently well above a second, the delay is in building the page on the server, and a caching plugin, faster queries or fewer heavy plugins will help more than compressing images.
What does "Resource Limit Is Reached" mean?
On CloudLinux shared hosting, each account has its own share of CPU, memory, disk I/O and simultaneous PHP processes. The error means your site needed more than its share at that moment. Check Metrics › Resource Usage in cPanel for faults, then look for heavy plugins, slow queries or external calls that leave PHP processes waiting.
Will upgrading my hosting plan make my site faster?
Only if your site is genuinely hitting its resource limits after you have optimised it. If the slowness comes from a heavy plugin, a slow query or an external service with no timeout, a bigger plan usually doesn't help, because the same code still waits for the same thing.
Which caching plugin should I use on Domain India shared hosting?
Our shared hosting runs the Apache web server, so use a caching plugin that works with Apache, such as WP Super Cache or W3 Total Cache for WordPress. Keep only one page-caching plugin active at a time.
Does changing my PHP version make my site faster?
Often, yes. Current PHP 8 versions are considerably faster than PHP 7 and 5, and old versions no longer receive security fixes. Take a backup, switch to the newest version your site supports, and test your key pages before relying on it.
Do I need a CDN?
Not always. A CDN helps most when your visitors are spread across many regions or your pages carry many images and files. It will not fix a slow server response on pages that can't be cached, such as a logged-in dashboard or checkout.
What should I include when I report a slow website to support?
The exact URL, the date and time you saw the problem, what is slow (public pages, admin area, checkout), any error message word for word, your PageSpeed Insights or WebPageTest results, and anything that changed recently, such as new plugins or a traffic spike.
Ready to get your site moving again? Work through the checks above, compare plans on Plans if you have outgrown yours, or open a ticket with your test results and we will look at your account with you.
Send us the slow page's URL, when it happens and your test results, and we will check your account's resource usage and logs with you.
Open a support ticket