"Resource Limit Is Reached" is the page visitors see when your hosting account has run out of its share of the server at that moment. It is rarely a fault on the server: something on your site, or something hitting it, is holding more PHP processes or memory than your account allows. This guide explains the error, how to find the real cause and how to fix it before you consider a bigger plan.
The error comes from CloudLinux, which gives every shared hosting account its own fixed share of CPU, memory and simultaneous PHP requests. A 508 "Resource Limit Is Reached" means your account hit its entry-process limit; memory and process limits show up as 500 or 503 errors instead. Check the Faults column in cPanel's Metrics › Resource Usage, find which URLs and visitors were busy at that time, and fix the cause: bot floods, login attacks, heavy plugins and cron jobs, or PHP requests stuck waiting on a slow outside service. Upgrade only if faults continue after that.
1. What the error actually means
Domain India cPanel and DirectAdmin hosting runs on CloudLinux (measured on our cPanel and DirectAdmin servers, 20 September 2026). CloudLinux gives each account fixed limits, so one busy or hacked site cannot slow down its neighbours. The trade-off is that your site is held to its share even when the server has spare capacity.
The limit that produces the "Resource Limit Is Reached" page is entry processes: the number of PHP requests your account can be running at the same moment. Every page view, form submission, AJAX call or login attempt that runs PHP holds one slot until it finishes. When all slots are full, the next request is refused with a 508 error.
A request that finishes in 200 milliseconds holds its slot for 200 milliseconds. A request waiting 60 seconds for a slow payment gateway holds it for 60 seconds. That is how a site with only a handful of real visitors can still run out: the problem is usually how long each request takes, not how many people arrive.
2. Which limit gives which symptom
Each limit fails in a different way, so matching the symptom to the limit saves guessing.
| Limit | What visitors see | What it usually points to |
|---|---|---|
| Entry processes | "Resource Limit Is Reached" (508) | Too many PHP requests at once, usually because each one is slow or a bot is sending many |
| Physical memory | 500 or 503 errors, pages that stop half-way | Imports, image processing or plugins that load large amounts of data |
| Number of processes | 500 or 503 errors, cron jobs that fail to start | Many cron jobs, SSH sessions or background scripts running together |
| CPU | The site slows down but still loads | Heavy plugins, uncached pages, slow database queries |
| I/O and IOPS | Slow admin area, slow imports and backups | Large backups, exports or database writes at busy times |
These are your account's limits. They are different from the PHP message "Allowed memory size exhausted", which comes from a single script's memory_limit setting. For that one, see How to fix "Allowed memory size exhausted" PHP errors.
3. The most common real causes
The cause is rarely "too many genuine customers". It is usually one of these.
wp-login.php and xmlrpc.php. Each attempt runs PHP and a database query, and one XML-RPC request can carry hundreds of guesses.Also check for open registration on WordPress, which attracts bursts of spam sign-ups, and back-end jobs such as imports, exports and plugin backups running while visitors arrive.
PHP requests stuck waiting: a cause we have investigated
This one fools almost everyone. We have investigated sites where the account showed repeated entry-process faults while its CPU and memory use stayed low. The cause was the site's own code checking a payment gateway's status for each pending order, one by one, with the cURL timeout set to 0, which means "wait forever". When the gateway slowed down, every page load running the check sat waiting, the slots filled up, and visitors got the 508 page. Other sites using the same software slowed down at the same moment: the giveaway that an outside service is to blame. A bigger plan does not fix this, because more slots just fill with more waiting requests. The fix is a timeout on the outbound call (section 5).
4. How to diagnose it step by step
Work out when the faults happened, then find what was running at that time.
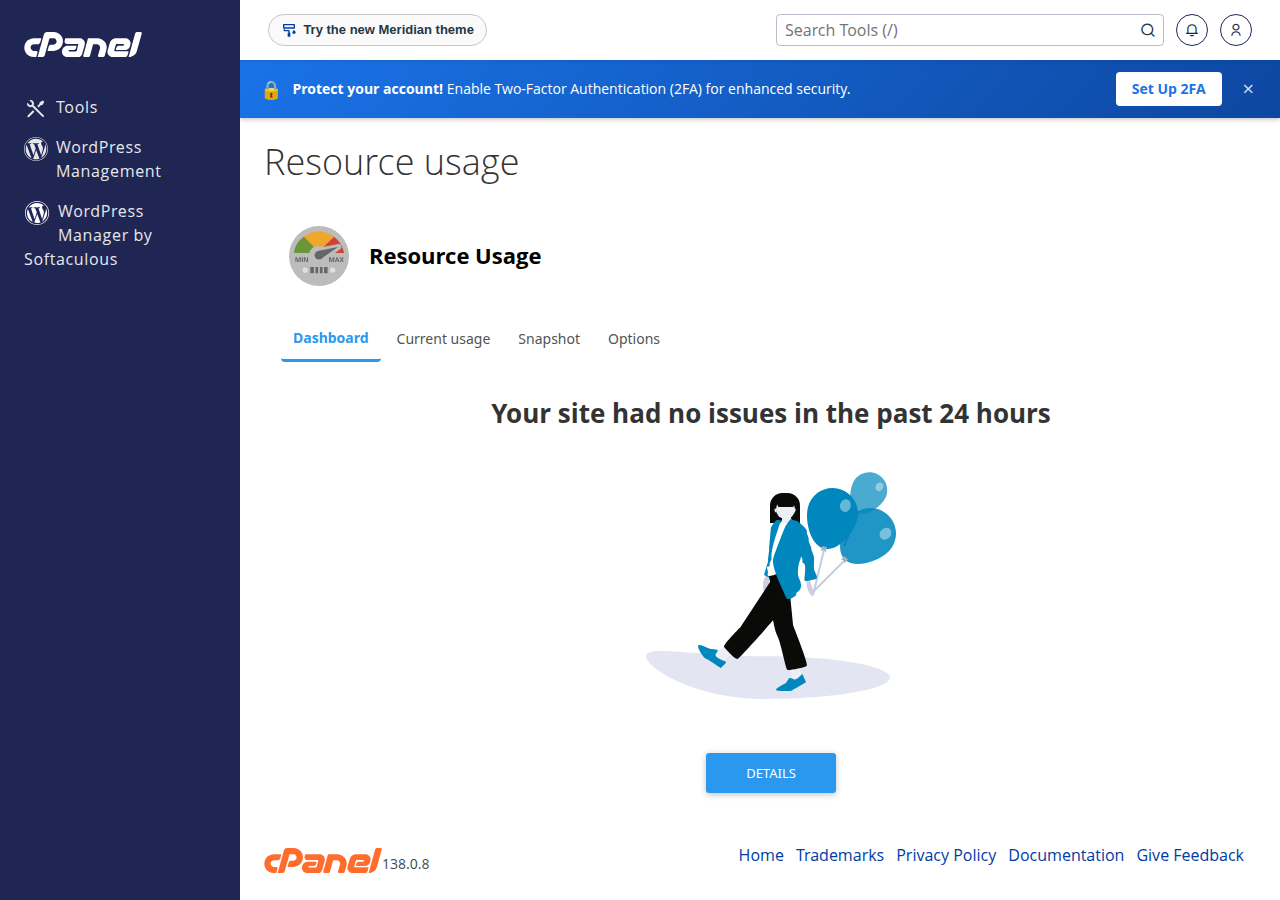
- Open Metrics › Resource Usage in cPanel.Choose the day or week when the error was reported, not only the current moment. The Faults column shows which limit was hit and when. Note the resource and the times. For the full walkthrough, see How to check your hosting resource usage.
- Compare faults with CPU and memory.Entry-process faults with high CPU point to heavy code or genuine load. Entry-process faults with low CPU and memory point to requests that were waiting, most often on an outside service.
- Look at the requests around those times.Metrics › Visitors gives a quick view of recent requests; for a complete picture, download the access logs from Metrics › Raw Access.
- Find who and what was busy.Count requests by IP address, by URL and by user agent (the browser or bot name) for the fault window. A few IPs or one bot name making most of the requests is a bot problem. Most requests going to
wp-login.phporxmlrpc.phpis an attack. Normal visitors spread across normal pages points back to slow code. - Check the error logs.Metrics › Errors shows recent entries; repeated timeouts on one script point at the slow file. See Reviewing error logs in cPanel and DirectAdmin.
- Test one change at a time.Deactivate a suspect plugin or block a bot, then watch Resource Usage over the next busy period to see whether the faults stop.
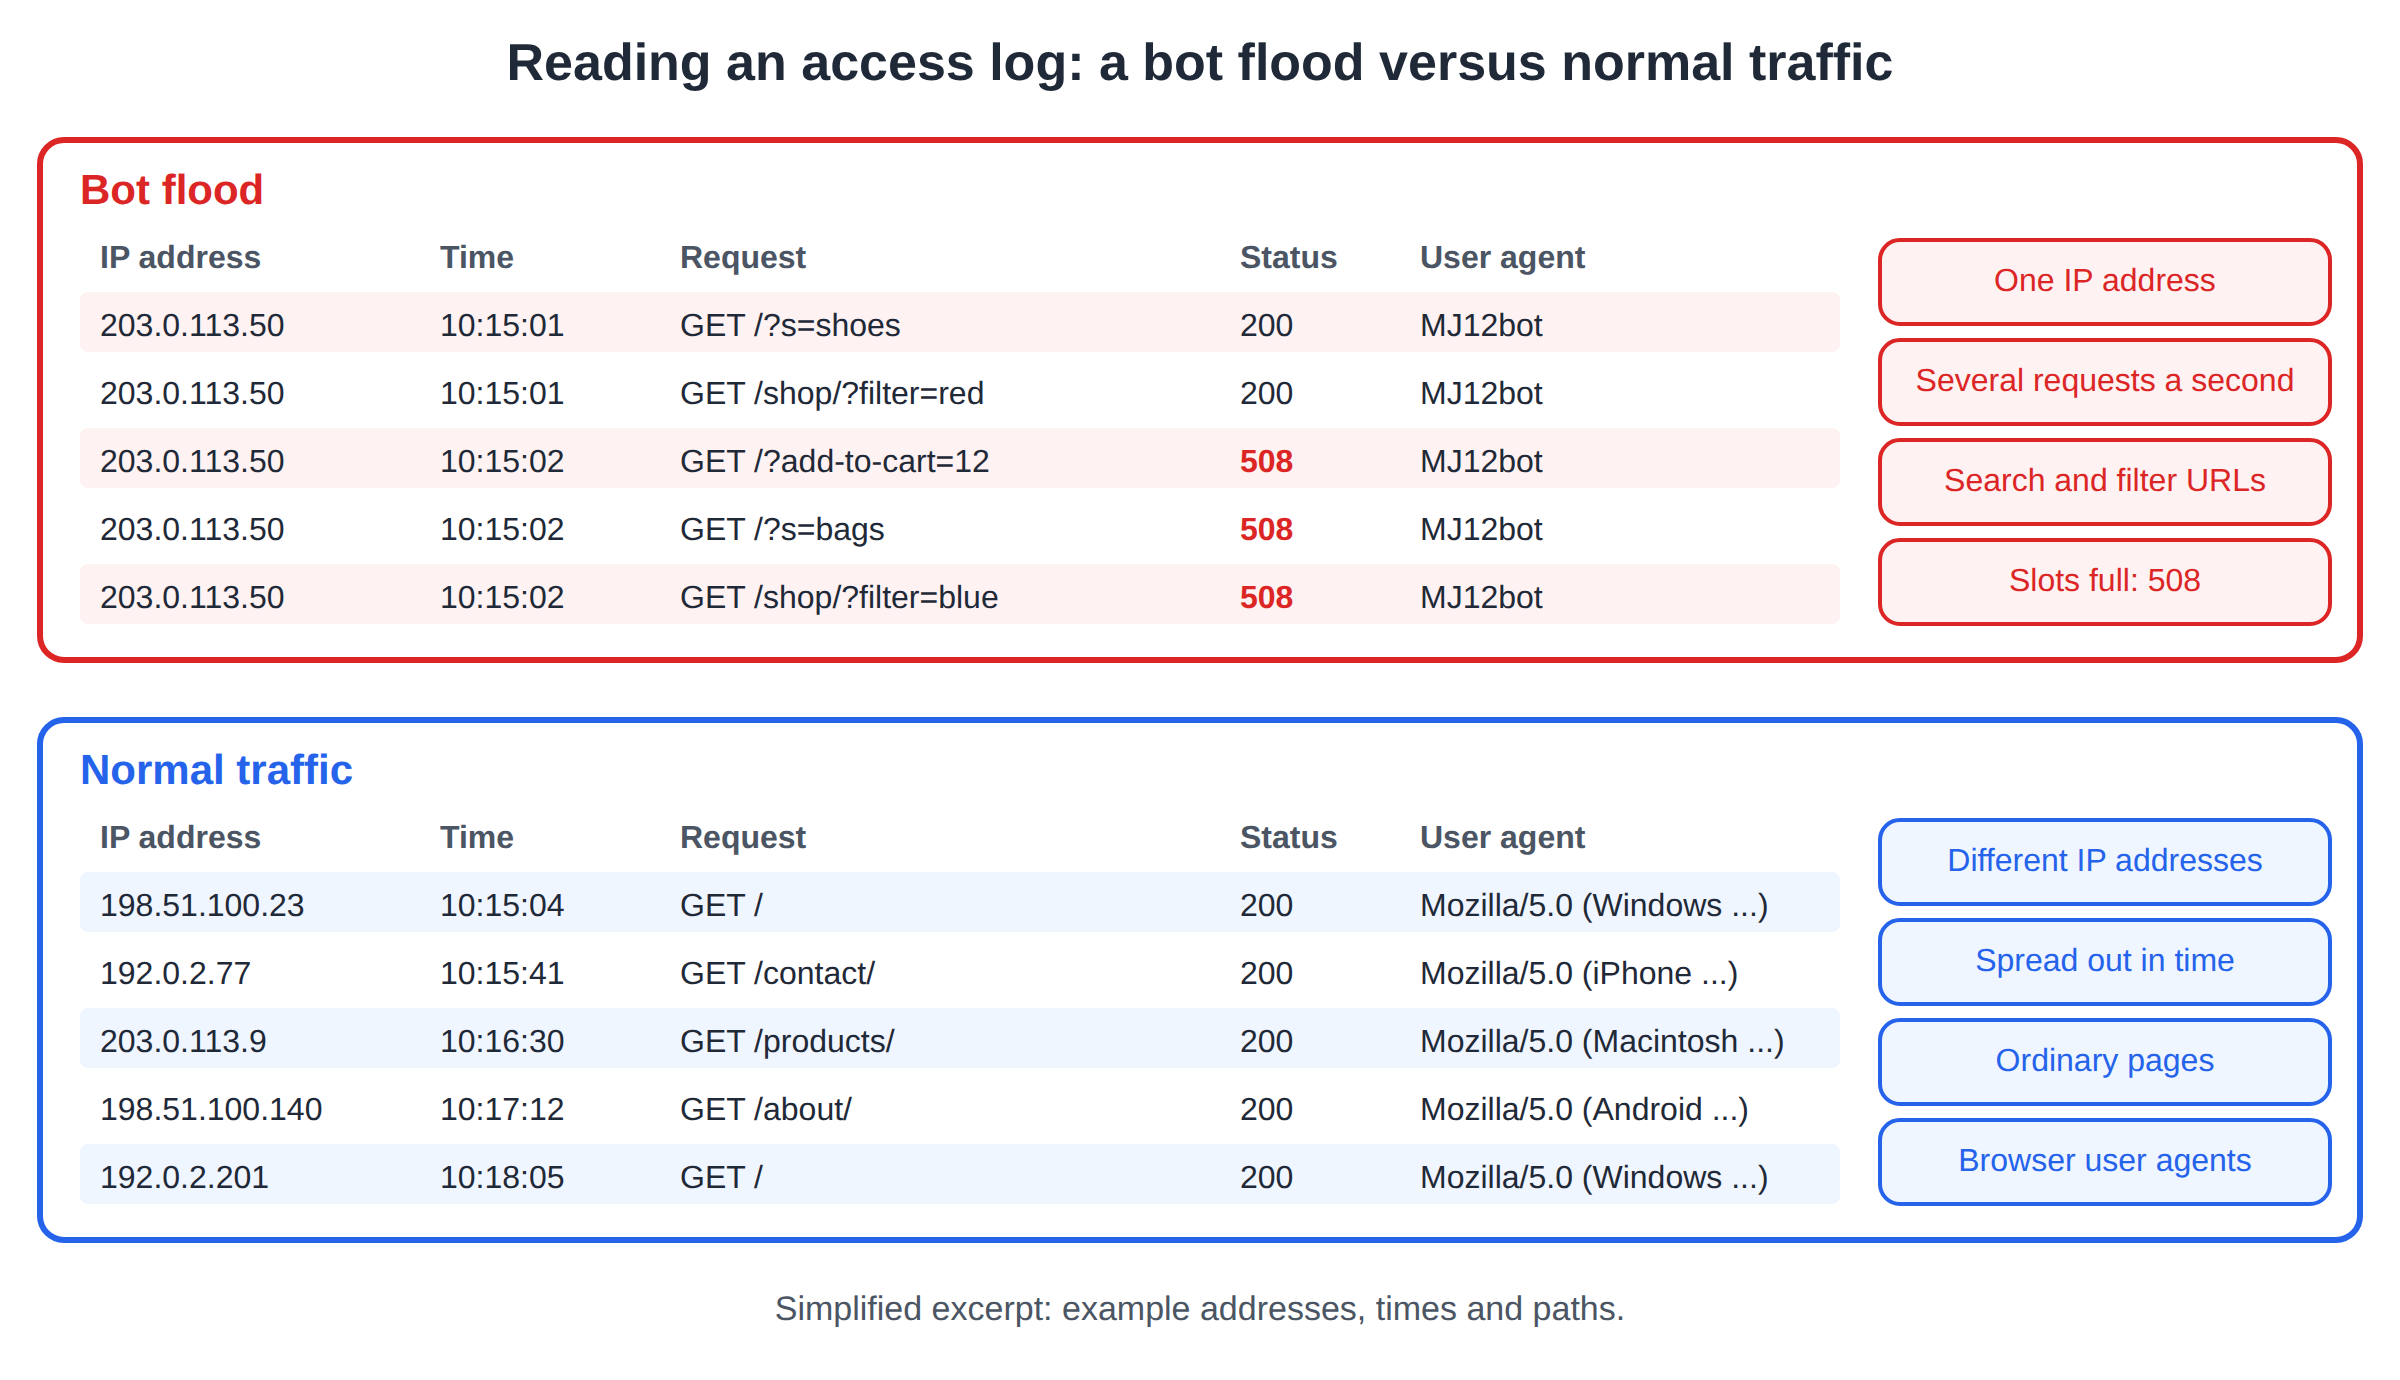
With SSH access, these commands summarise your access logs (file names vary by domain and date). They also work on your own computer against a log downloaded from Raw Access.
# Top 20 IP addresses
zcat -f ~/logs/yourdomain.com-ssl_log* | awk '{print $1}' | sort | uniq -c | sort -rn | head -20

# Top 20 URLs requested
zcat -f ~/logs/yourdomain.com-ssl_log* | awk '{print $7}' | sort | uniq -c | sort -rn | head -20

# Top 20 user agents (bot names)
zcat -f ~/logs/yourdomain.com-ssl_log* | awk -F'"' '{print $6}' | sort | uniq -c | sort -rn | head -20
DirectAdmin. Our DirectAdmin server also runs CloudLinux, so the same limits and symptoms apply; open Resource Usage in DirectAdmin to see your account's usage and any limit faults. Webuzo. Our Webuzo server doesn't run CloudLinux, so this error works differently there; if your site seems slow or limited, open a ticket and we will check it for you.
5. How to fix each cause
Cache your pages
Page caching is the biggest win: a cached page is served without running PHP, so it never takes an entry-process slot. Domain India shared hosting runs the Apache web server, so on WordPress use WP Super Cache or W3 Total Cache; don't rely on a plugin that only works with LiteSpeed. Keep only one page-caching plugin active. Pages that can't be cached, such as the cart, checkout and account pages, still run PHP, so keep them light.
Block bad bots, carefully
Start with robots.txt: well-behaved SEO and AI crawlers obey a Disallow line for their user agent. Bing respects a Crawl-delay line; Google does not, and Googlebot slows itself down automatically when a site returns errors.
For bots that ignore robots.txt, you can refuse them in .htaccess. .htaccess rules work on our shared hosting. Add this near the top of the .htaccess file in your site's root folder, and adjust the list to the names you actually found in your logs:
RewriteEngine On
RewriteCond %{HTTP_USER_AGENT} (MJ12bot|AhrefsBot|SemrushBot|DotBot|PetalBot|Bytespider) [NC]
RewriteRule .* - [F,L]Never block Googlebot or Bingbot, or your pages drop out of search results. Copy .htaccess before editing and load your site straight after: a typo gives every visitor a 500 error. Bots can fake their name, so if one IP range keeps returning under different names, send us the details rather than blocking whole networks.
Our cPanel servers run Imunify360 with a web application firewall and bot protection turned on server-wide (measured 20 September 2026). It stops many attacks, but not every crawler, so your own logs still matter.
Stop login and XML-RPC attacks
- Disable XML-RPC if you don't use it. Only the WordPress mobile app and a few older plugins need it. To refuse it in
.htaccess:
<Files xmlrpc.php>
    Require all denied
</Files>- Limit login attempts with a security plugin, and use strong, unique passwords for every administrator.
- Turn off open registration under Settings › General › Membership if you don't need visitors to create accounts.
Tame heavy plugins and WordPress cron
Remove unused plugins and test suspects one at a time, as described in My website is slow; the free Query Monitor plugin shows which plugin makes the slowest queries. WordPress also runs its scheduled tasks (WP-Cron) on page visits, so a busy site can start them at the worst moment. Move them to a real cron job:
- Turn off the visit-triggered cron.Add
define('DISABLE_WP_CRON', true);towp-config.php, above the line that says to stop editing. - Add a real cron job.In cPanel, open Cron Jobs and run
wp-cron.phpevery 15 minutes. The exact command is in WordPress cron and scheduled tasks. - Schedule heavy work for quiet hours.Set imports, exports and plugin backups to run at night, not during the day when visitors arrive.
Put a timeout on every outbound call
If requests were waiting, give every call to another service a timeout of a few seconds.
- PHP cURL: set both
CURLOPT_CONNECTTIMEOUTandCURLOPT_TIMEOUT. A value of0means "wait forever". - WordPress: pass a
timeouttowp_remote_get()andwp_remote_post(). The default is 5 seconds; check that a plugin has not raised it. - Don't call a slow service in a loop on a page load, such as checking every pending order's payment status one by one. Move that work to a cron job.
- Cache answers that rarely change, such as exchange rates.
Developers can find cURL timeouts in a site's code with:
grep -rnoE "CURLOPT_(CONNECT)?TIMEOUT[^,)]*" ~/public_htmlSome PHP network functions are disabled on shared hosting for security, which can also make a plugin fail or hang. See PHP disabled functions on shared hosting.
6. When an upgrade is the right answer
Upgrade when Resource Usage still shows regular faults after you have added caching, blocked abusive traffic and fixed slow code, or when genuine traffic has grown.
An active cPanel or DirectAdmin plan can be upgraded at any time: open Hosting › My hosting, select your hosting service and choose Change plan. You pay only the difference for the time left until your renewal date, plus 18% GST, and the new limits apply as soon as that invoice is paid. Your files, email and login stay the same. Webuzo and Windows customers should contact support before changing plan. Full details: Can I upgrade my web hosting package at any time?
7. Where Domain India plans fit
A bigger shared plan suits a site whose code is already efficient but whose traffic, websites or storage have grown.
- 50 GB NVMe SSD Storage
- 100 GB Monthly Bandwidth
- 5 Websites
- 50 Email Accounts
A VPS gives you dedicated vCPU and RAM with full root access, so you can tune PHP and the web server yourself. It suits busy shops and custom applications.
- 1 vCPU
- 2 GB DDR4 RAM
- 64 GB NVMe SSD Storage
- 2 TB Monthly Bandwidth
Prices on the cards are live and exclude 18% GST. To compare every option, see cPanel hosting, DirectAdmin hosting and VPS servers.
8. What to send support
A detailed ticket gets to the answer much faster. Include:
- the exact page and the error as shown (508, 500 or 503);
- the date and time it happened, with time zone;
- which resource faulted, from Resource Usage;
- anything that changed recently, such as a new plugin, campaign or payment integration, and what you have already tried.
We can count requests across all your logs for you. Support is available on 24/7 live chat, and tickets get a first response within 15 minutes; how long a fix takes depends on the issue. We do not offer phone support. Open a ticket at /support/ticket, or from the client area at New ticket.
What does "Resource Limit Is Reached" mean?
It means your hosting account reached its entry-process limit: the number of PHP requests it can run at the same time. Domain India cPanel and DirectAdmin hosting runs on CloudLinux, which gives every account its own share of CPU, memory and simultaneous PHP requests. When all the slots are busy, new visitors see a 508 "Resource Limit Is Reached" page until some requests finish.
Is the 508 error the same as a 503 or 500 error?
No. A 508 "Resource Limit Is Reached" comes from the entry-process limit. Hitting the physical memory limit or the number-of-processes limit usually shows visitors a 500 or 503 error instead. The Faults column in cPanel's Metrics › Resource Usage tells you which limit was hit.
How do I find out what caused the error?
Open Metrics › Resource Usage in cPanel and note when the faults happened and which resource was hit. Then download your access logs from Metrics › Raw Access and count requests in that window by IP address, URL and user agent. Bots, login attacks and slow scripts each leave a clear pattern.
My site has very few visitors. Why do I still get this error?
Because the limit counts requests running at the same moment, not visitors. If each request is slow, for example because it waits for a payment or SMS service with no timeout, a few visitors are enough to fill every slot. Bots and login attacks can also add many requests that are not real visitors.
Can bots cause "Resource Limit Is Reached"?
Yes, it is one of the most common causes. Aggressive crawlers and attacks on wp-login.php and xmlrpc.php can send hundreds of requests a minute. Find the bot names in your access logs and refuse abusive ones with robots.txt or an .htaccess rule, never blocking Googlebot or Bingbot.
Will upgrading my hosting plan fix it?
Only if your site genuinely needs more resources after you have added caching, blocked abusive traffic and fixed slow code. If requests are waiting on a slow outside service, a bigger plan only lets more requests wait. When an upgrade is right, choose Change plan on your hosting service under Hosting › My hosting.
Does the number of WordPress plugins trigger this error?
Not by itself. Your account's limits count CPU, memory and simultaneous PHP requests, not plugins. A few heavy plugins can cause faults while many light ones may not, so test suspects one at a time and remove what you don't use.
Ready to stop the error for good? Check your faults with How to check your hosting resource usage, work through My website is slow, or open a ticket and we will read your usage and logs with you.
Tell us the page, the time it happened and what Resource Usage showed, and we will check your account's usage and logs with you.
Open a support ticket