Your hosting control panel records every request made to your website, and turns those logs into visitor statistics: how many people came, which pages they read, where they came from and which errors they hit. This guide shows where the statistics are in cPanel, DirectAdmin and Webuzo, what each tool is good for, and how to read the numbers without being misled.
In cPanel, open the Metrics section: Awstats gives the fullest traffic reports, Visitors shows the most recent individual requests, Raw Access lets you download the log itself, and Errors shows the latest error messages. The reports are rebuilt from the logs once a day, so today's traffic appears tomorrow. On our DirectAdmin server, Webalizer is the statistics tool. Log statistics count bots as well as people, so expect them to be higher than Google Analytics.
1. Where to find your statistics
Sign in to your control panel first. The easiest way is from the client area: see how to log in to cPanel.
| Control panel | Where the statistics are | Tools available |
|---|---|---|
| cPanel | Metrics section on the cPanel home page | Awstats, Webalizer, Analog Stats, Visitors, Raw Access, Errors, Bandwidth, Webalizer FTP |
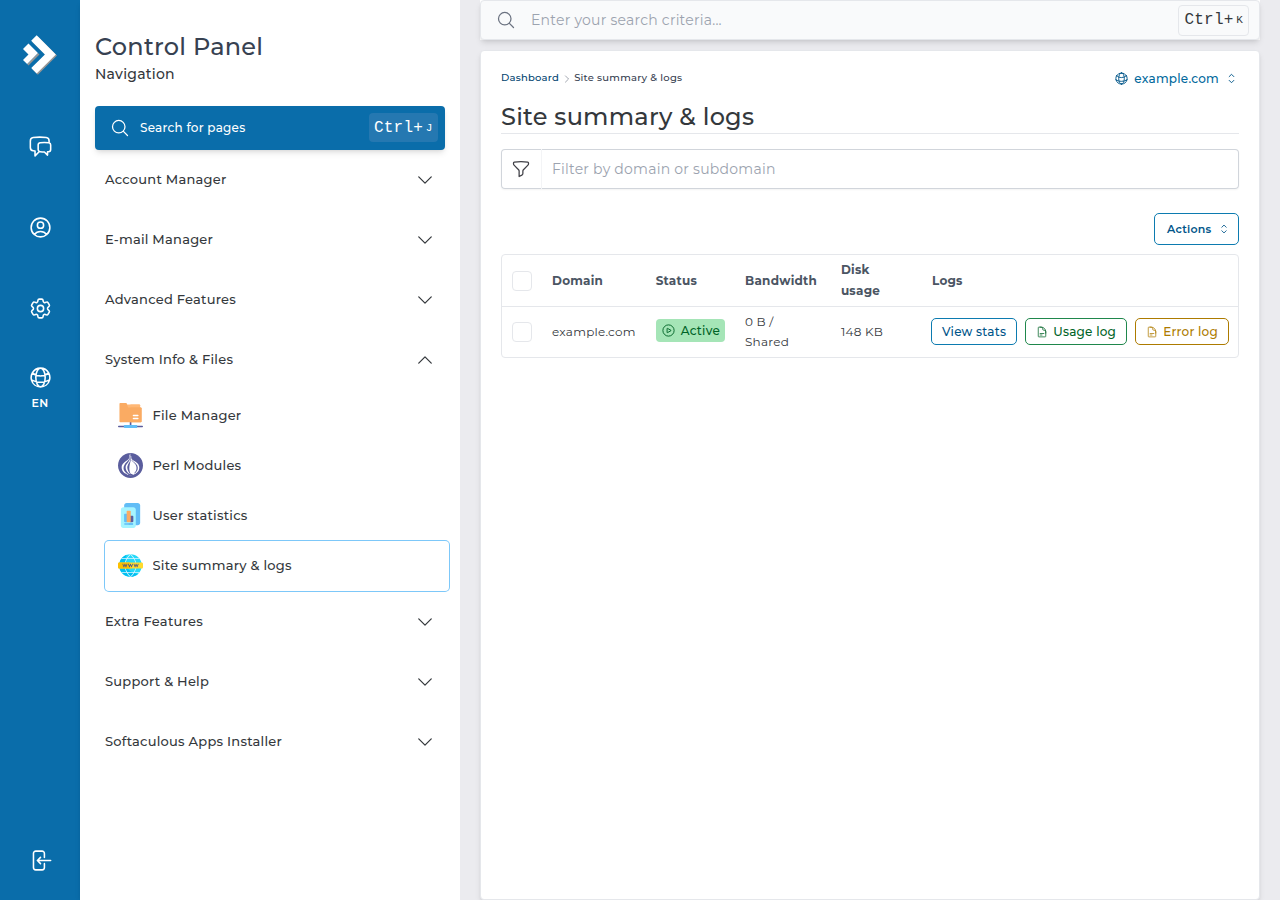
| DirectAdmin | System Info & Files › Site summary & logs, then View stats | Webalizer (AWStats is switched off on our DirectAdmin server); the same page has Usage log and Error log |
| Webuzo | Error Log page | No visitor statistics tool in the panel; for visitor numbers, add an analytics service such as Google Analytics |
The cPanel list above is what our cPanel server shows today (checked on 23 September 2026). For DirectAdmin, our step-by-step guide is how to check website statistics in DirectAdmin.
2. The cPanel Metrics tools, one by one
Bandwidth, in the same section, shows how much data your sites have served. cPanel's separate Resource Usage page shows the CPU, memory and process limits of your account, which is a different thing from visitor numbers: see how to check hosting resource usage.
3. Open AWStats in cPanel
- Open Awstats.On the cPanel home page, scroll to Metrics and click Awstats. You can also type "awstats" in the search box at the top.
- Pick the domain.cPanel lists each domain and subdomain. Click View next to the one you want. Secure (https) and plain (http) traffic can appear as separate rows; most sites today are almost all https.
- Choose the month.Use the month and year selector at the top of the report, then click OK.
- Read the summary first.The top table gives unique visitors, visits, pages, hits and bandwidth for the month. The sections below break it down by day, hour, country, page, referrer and browser.
AWStats on our cPanel server shows visitors by IP address rather than by host name, because reverse DNS lookups are switched off to keep the daily processing fast.
4. How to read the numbers
Most confusion about statistics comes from four words that sound similar.
| Term | What it counts | Why it matters |
|---|---|---|
| Hits | Every file requested: the page, plus each image, stylesheet and script on it | Always the biggest number. Not a measure of people |
| Pages | Requests for actual pages, not images or scripts | Closer to "what people read" |
| Visits | A series of requests from one visitor, ended by a gap of inactivity | Roughly "sessions" |
| Unique visitors | Different IP addresses seen in the period | An estimate: several people can share one IP, and one person can use several |
Log-based tools such as AWStats see every request that reaches the server, including search engine crawlers, uptime monitors, feed readers and malicious scanners. AWStats tries to separate known robots into their own section, but it can't recognise them all. Google Analytics counts only visitors whose browser runs its tracking script and who accept it. Neither is wrong; they measure different things.
On our cPanel server, requests pass through a caching layer in front of the web server. The statistics are built from that front layer's logs, so pages served from the cache are counted too (we checked this on 23 September 2026).
5. Why today's numbers are missing
The statistics are not live. On our cPanel server the logs are processed into AWStats, Webalizer and Analog reports once every 24 hours. So:
- Traffic from today normally appears in tomorrow's report.
- A brand-new domain can show "no stats to display" for its first day.
- If you need to see what is happening right now, use Visitors (the most recent requests) or Errors, which read the current log.
Statistics also stop updating if the account is suspended, or if the domain doesn't point to our server: requests that never reach us can't be counted. If your domain's DNS is elsewhere, see how to change your nameservers.
6. Raw access logs: download and keep them
The raw log is the source for every other tool. Each line is one request: IP address, time, the page requested, the status code (200, 404, 500 and so on), the size, the referring page and the browser.
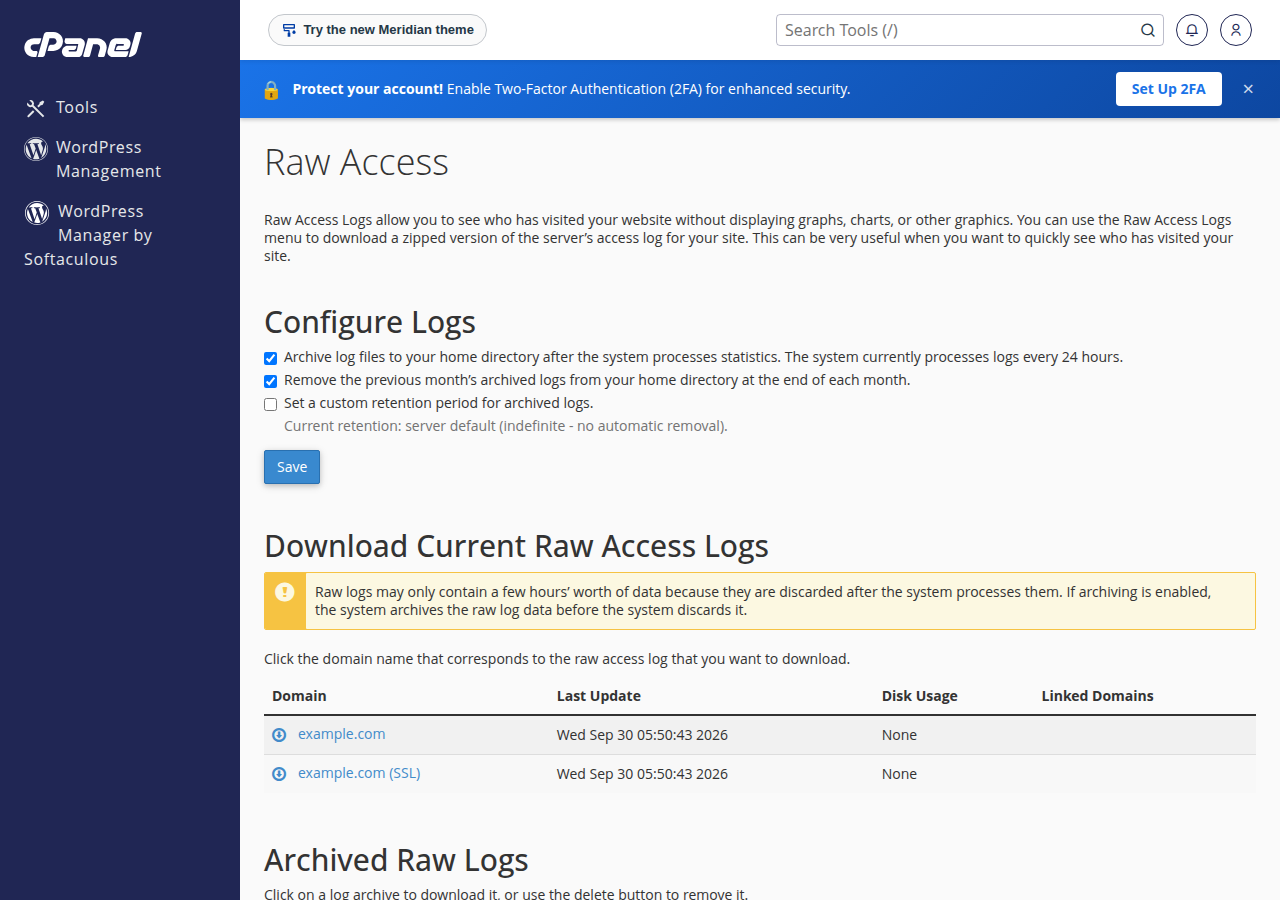
In cPanel, open Metrics › Raw Access:
- Click a domain under Download Current Raw Access Logs to download today's log as a compressed file.
- Under Archived Raw Logs, download older months that have been archived into the
logsfolder of your home directory. - Configure Logs lets you decide whether the previous month's archive is removed from your home directory at the end of each month, or kept for a retention period you set. Archives use your disk space, so keep only what you need.
For reading error logs in detail, see reviewing error logs in cPanel and DirectAdmin.
An access log is personal data about your visitors. Store downloaded logs securely, don't publish them, and delete them when you no longer need them.
7. Use the statistics to fix real problems
- Sudden traffic spike, no new customers. Check the robots and hosts sections in AWStats, or sort the raw log by IP. One IP or one crawler making thousands of requests is a bot, not an audience.
- Many 404 errors. Look at the error codes and "pages not found" sections. Broken links after a redesign are common; fix them or add redirects.
- Many 500 or 503 errors. The site is failing, not just missing pages. Check Errors and your resource usage, and see troubleshooting a 500 Internal Server Error.
- Bandwidth higher than expected. Large images, videos or downloads usually explain it. See why a website says bandwidth limit exceeded.
- Slow site at certain hours. Compare the hourly table with Resource Usage, and read my website is slow.
8. Add analytics for marketing data
Server statistics can't tell you which campaign brought a visitor or whether they bought something. For that, add a browser-based tool such as Google Analytics, and verify your site in Google Search Console to see the searches that show your pages. Use both: analytics for people, server statistics for everything that reaches the server.
9. Statistics on Domain India hosting
Every Domain India cPanel and DirectAdmin hosting plan includes the statistics tools described above at no extra cost, and you can see your account's CPU and memory usage alongside them. If you are choosing a plan, cPanel gives you the widest set of statistics tools:
- 25 GB NVMe SSD Storage
- 50 GB Monthly Bandwidth
- 1 Website
- 10 Email Accounts
The card shows the Domain India list price on 19 September 2026, excluding 18% GST. Compare every plan on cPanel hosting and DirectAdmin hosting.
If a statistics page is empty or stuck, our support team is on 24/7 live chat, and tickets get a first response within 15 minutes. There is no phone support.
10. Frequently asked questions
Where are website statistics in cPanel?
Sign in to cPanel and scroll to the Metrics section. It contains Awstats, Webalizer, Analog Stats, Visitors, Raw Access, Errors and Bandwidth. Awstats gives the most complete traffic report.
Why don't I see today's visitors in AWStats?
On Domain India's cPanel server the logs are processed into AWStats, Webalizer and Analog reports once every 24 hours, so today's traffic normally appears in tomorrow's report. The Visitors tool shows the most recent requests if you need to see current activity.
Why are my AWStats numbers higher than Google Analytics?
AWStats counts every request that reaches the server, including search engine crawlers, monitors and scanners it can't identify as robots. Google Analytics counts only browsers that run its tracking script. The two measure different things, so the numbers never match.
What is the difference between hits and visits?
A hit is any file requested, including every image, stylesheet and script on a page, so one page view can create dozens of hits. A visit is a series of requests from one visitor within a period of activity. Visits and pages are closer to real reader numbers than hits.
How do I download my website's access log?
In cPanel, open Metrics, then Raw Access, and click your domain under Download Current Raw Access Logs. Older archived months are listed under Archived Raw Logs. The file is compressed and can be opened with a text editor or a log analysis tool.
Which statistics tool does DirectAdmin hosting use?
On Domain India's DirectAdmin server, Webalizer is enabled and AWStats is switched off. In DirectAdmin, open System Info & Files, Site summary & logs, and click View stats.
Ready to dig into your numbers? Sign in to your control panel from My Hosting in the client area, or compare cPanel hosting plans if you are starting a new site.
Tell us the domain and which statistics tool is empty or out of date, and our support team will check the log processing for your account.
Open a support ticket