Your shared hosting account has its own share of the server: CPU, memory, disk activity and a number of PHP requests it can run at once. When your site needs more than that share, it slows down or shows an error. This guide shows where to see your usage in cPanel, what a "fault" means, and what to do before you pay for a bigger plan.
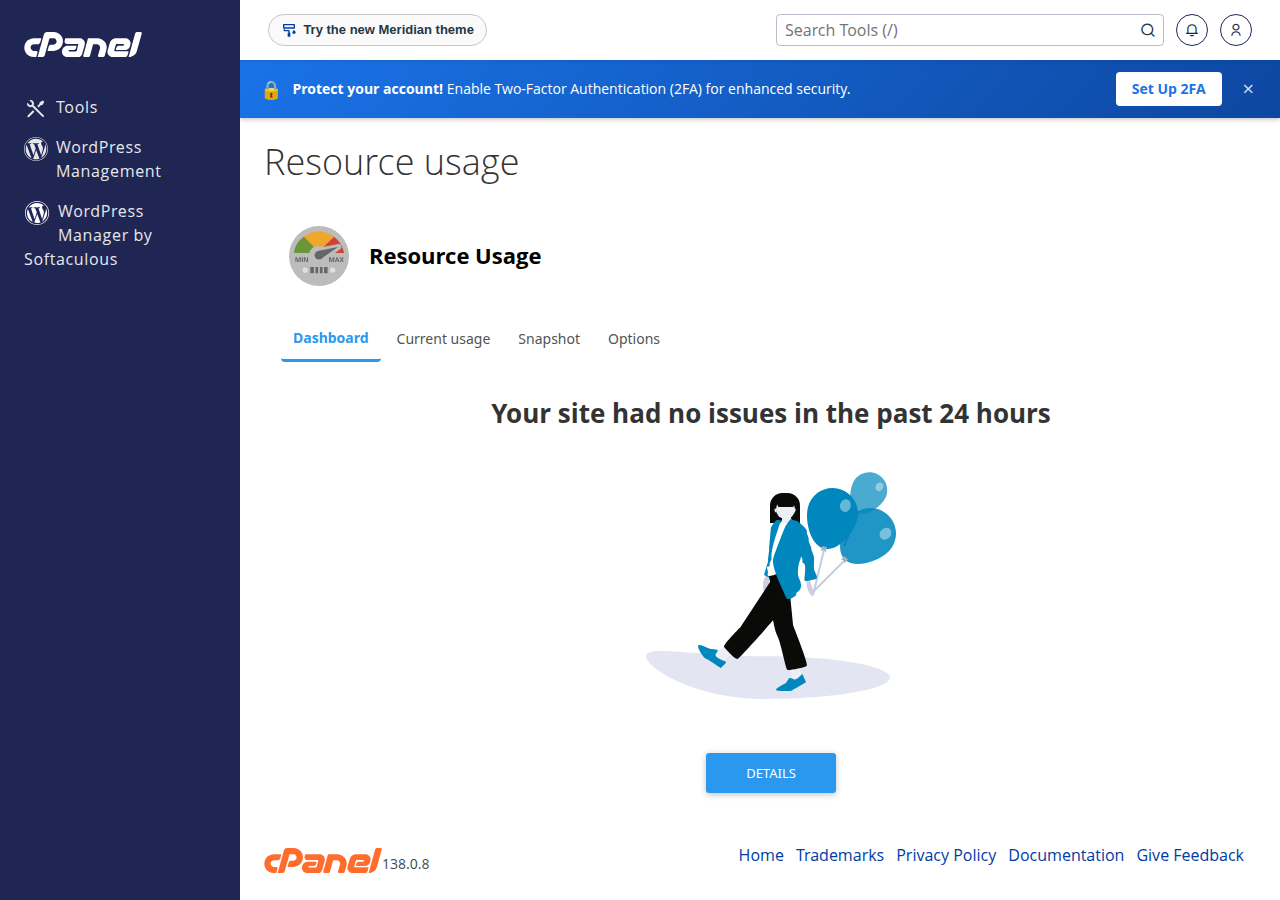
In cPanel, open Metrics › Resource Usage to see CPU, physical memory, entry processes, I/O and processes over time. The Faults column counts the moments your account hit a limit: CPU and I/O faults slow the site down, entry-process faults show visitors a "Resource Limit Is Reached" (508) error, and memory or process faults cause 500 or 503 errors. Fix the cause first, and upgrade only if faults continue, from Hosting › My hosting › your hosting service › Change plan.
For the error itself, see Understanding and troubleshooting the "Resource Limit Is Reached" error. For a full diagnosis of a slow site, see My website is slow.
1. Why your account has limits
Domain India shared hosting runs on CloudLinux (measured on our cPanel and DirectAdmin servers, 20 September 2026). CloudLinux gives each account its own fixed share, so one busy or hacked site cannot slow down every other site on the server. The trade-off is that your site is held to its share even when the server has room to spare.
2. The resources you will see
| Resource | What it measures | What happens at the limit |
|---|---|---|
| CPU | Processor time used by your scripts, cron jobs and other processes | The site is slowed down but still loads |
| Physical memory | RAM used by all your processes together | The process is stopped; visitors may see a 500 or 503 error |
| Entry processes | PHP requests running at the same moment | New visitors get a "Resource Limit Is Reached" (508) error |
| Number of processes | Everything running under your account, including cron and SSH | New processes can't start; errors like the memory limit |
| I/O and IOPS | How fast, and how often, your account reads and writes to disk | Disk access slows; imports, backups and busy databases drag |
| Disk space and inodes | Storage used, and the number of files and folders | Uploads, new mail and database writes fail when full |
Entry processes are not visitors. A cached page frees its slot in a fraction of a second; a page waiting on a slow query or an outside service holds its slot the whole time. That is how a site with few visitors can still run out.
3. How to check your usage in cPanel
- Log in to cPanel.Use the login button on your hosting service in the client area, or see How to login to cPanel.
- Open Metrics › Resource Usage.This shows your usage history, which is what you need for a problem that comes and goes.
- Choose the right time period.Pick the day or week when visitors reported errors or slowness, not only the current moment.
- Read the Faults column.Any number above zero means your account hit that limit. Note which resource and when.
DirectAdmin. Our DirectAdmin server also runs CloudLinux, so the same kinds of limits apply; open Resource Usage in DirectAdmin to see your account's usage and any limit faults. Webuzo. Our Webuzo server doesn't run CloudLinux, so these limits don't apply in the same way; if your site seems slow or limited, open a ticket and we will check it for you.
4. What the faults tell you
A physical-memory fault is different from the PHP message "Allowed memory size exhausted", which comes from one script's own memory_limit. For that, see How to fix "Allowed memory size exhausted" PHP errors.
5. How to bring usage down
- Cache your pages. On WordPress, WP Super Cache or W3 Total Cache serves most visitors without running PHP. Our shared hosting runs Apache, so don't rely on a LiteSpeed-only plugin, and keep only one caching plugin active.
- Remove heavy or unused plugins, one at a time, re-checking Resource Usage after each.
- Set a timeout of a few seconds on every outside call your site makes.
- Run imports, exports and plugin backups at quiet hours, and slow down aggressive crawlers.
- Clean up disk and inodes: old backups, unused installs, cache folders and mail you no longer need.
6. When to upgrade
Upgrade when faults continue after you have fixed the causes above, or when your traffic has genuinely grown. If requests are waiting on a slow service, a bigger plan only lets more of them queue up. An active cPanel or DirectAdmin plan can be upgraded at any time: open Hosting › My hosting, select your hosting service and choose Change plan. You pay only the difference for the time left until your renewal date, plus 18% GST, and the new limits apply as soon as that invoice is paid. Your files, email and login stay the same. Webuzo and Windows customers should contact support before changing plan. Details: Can I upgrade my web hosting package at any time?
- 50 GB NVMe SSD Storage
- 100 GB Monthly Bandwidth
- 5 Websites
- 50 Email Accounts
If you need more than any shared plan offers, a VPS gives you dedicated CPU and memory. The price on the card is live and excludes 18% GST.
7. Getting help
Send us when the problem happened, the page affected and which resource showed faults. Support is available on 24/7 live chat, and tickets get a first response within 15 minutes; how long a fix takes depends on the issue. We do not offer phone support.
Where can I see my hosting resource usage in cPanel?
Log in to cPanel and open Metrics › Resource Usage. It shows CPU, physical memory, entry processes, I/O and number of processes over time, with a Faults column that counts each time your account hit a limit.
What is a fault in cPanel Resource Usage?
A fault is a moment when your account reached one of its CloudLinux limits. CPU and I/O faults slow the site down, entry-process faults show visitors a "Resource Limit Is Reached" (508) error, and memory or process faults can cause 500 or 503 errors.
My CPU and memory are low, so why do I get "Resource Limit Is Reached"?
Usually because PHP requests are waiting rather than working, most often on an outside service called with no timeout. Each waiting request holds an entry process until the limit is reached. Set a timeout on every external call and cache pages that don't change.
Will upgrading my plan stop the faults?
Only if your site genuinely needs more resources after you have optimised it. Faults caused by a slow plugin, query or external call usually continue on a bigger plan. When an upgrade is right, choose Change plan on your hosting service under Hosting › My hosting.
Ready to see what your site is using? Open Metrics › Resource Usage in cPanel, work through My website is slow if you find faults, or open a ticket and we will read the numbers with you.
Tell us when the problem happened and which page was affected, and we will check your account's resource usage and logs with you.
Open a support ticket