When your website shows a blank page, a 500 error or a feature that silently stops working, the reason is almost always written in a log. This guide shows where the logs are in cPanel and DirectAdmin, what each one records, and how to turn a log line into a fix.
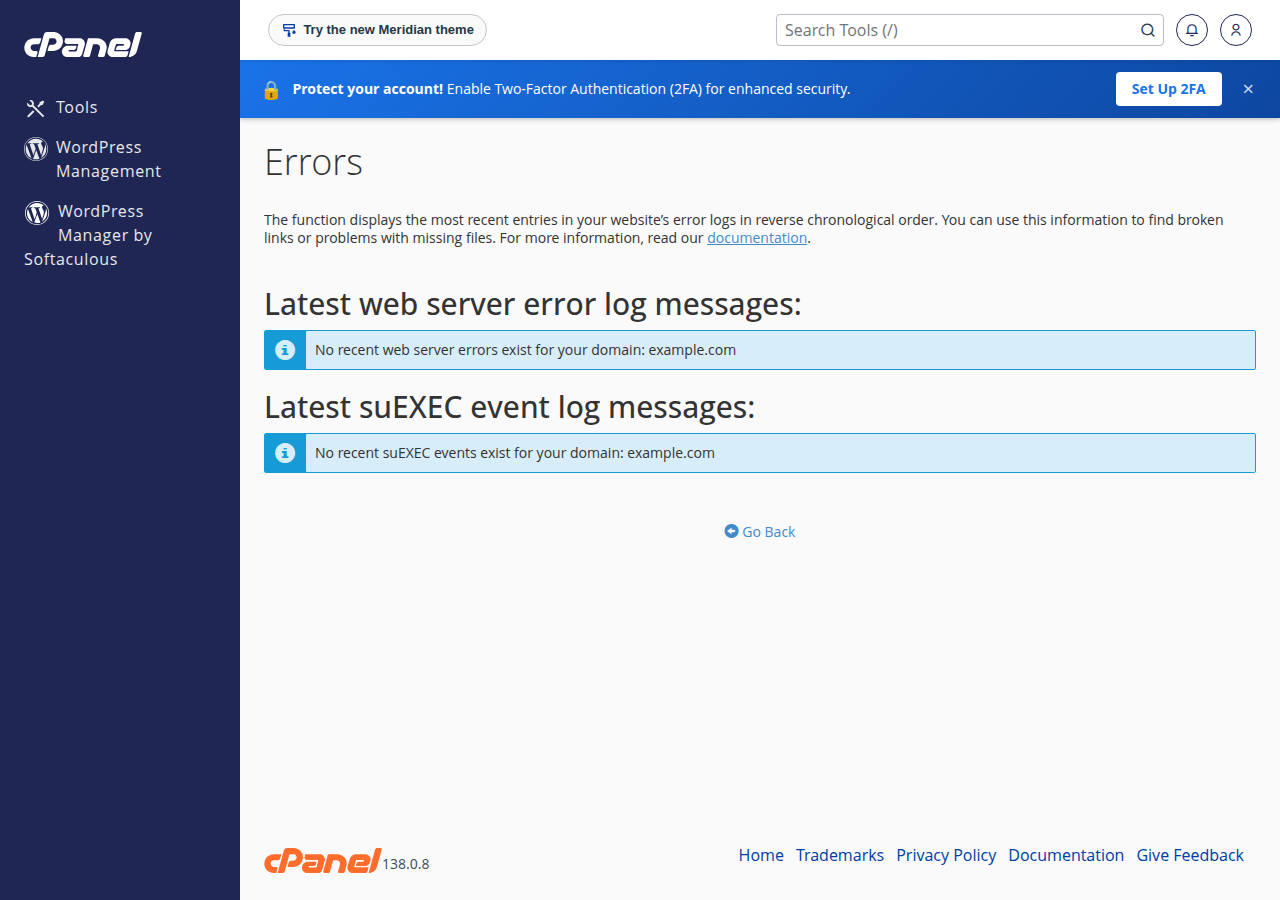
In cPanel, open Metrics › Errors for recent web server errors, then look for a file called error_log in the same folder as the failing script: that is where PHP usually writes its errors. Metrics › Raw Access gives you the access log: who requested what, and which status code they got. Match the log line to the exact time you reproduced the problem. On DirectAdmin each domain has its own error and access log, under System Info & Files › Site summary & logs.
1. Which log answers which question
| Your question | Log to open | Where |
|---|---|---|
| Why did this page give a 500 or 403? | Web server error log | cPanel: Metrics › Errors |
| Which PHP line crashed? | PHP error_log file | The folder of the failing script |
| Who requested this page, and what did they get? | Access log | cPanel: Metrics › Raw Access |
| What went wrong inside WordPress? | WordPress debug.log | wp-content/debug.log, once turned on |
| Is my account hitting its limits? | Resource usage and faults | cPanel: Metrics › Resource Usage |
The last row is not a log, but a 500, 503 or 508 that comes and goes is often a resource limit rather than a code fault. See How to check your hosting resource usage.
2. cPanel: Metrics › Errors
- Reproduce the problem and note the time.Load the failing page with a unique query string such as
?t=logtest1, so you can recognise your own request later. - Log in to cPanel.Use the login button on your hosting service in the client area, or see How to login to cPanel.
- Open Metrics › Errors.It lists the most recent web server errors for your account, newest first.
- Find the line that matches your time and page.Older lines are history.
This view shows recent entries only. For an error from days ago, reproduce it rather than hunting for the old line.
Our cPanel servers run nginx in front of Apache as a caching proxy, and it can keep serving a stored copy of a page for up to 120 minutes (measured 22 September 2026). A request served from that cache never reaches Apache, so it writes no log line. Add ?t= with a new value each time you test, so your request reaches Apache and gets logged.
3. The error_log file next to your script
When a PHP script fails, PHP often writes the message to a file called error_log in the same folder as that script: for example public_html/error_log for the home page, or public_html/wp-admin/error_log for a WordPress admin problem. A site in a subfolder or an addon domain has its own error_log in its folder.
Open File Manager, go to the folder of the failing page and open error_log; the newest lines are at the bottom. See How do I use the File Manager. These files count towards your disk space, so once the cause is fixed you can delete one; PHP creates a fresh file the next time something fails.
4. Raw Access: who requested what
The access log records each request that reached the web server: IP address, time, page, status code and browser or bot name. Use it to see which pages fail and for whom, or to spot a bot hammering one URL.
In cPanel, open Metrics › Raw Access and download the log for your domain. It is a compressed .gz file; open it with any archive tool and read it in a text editor.
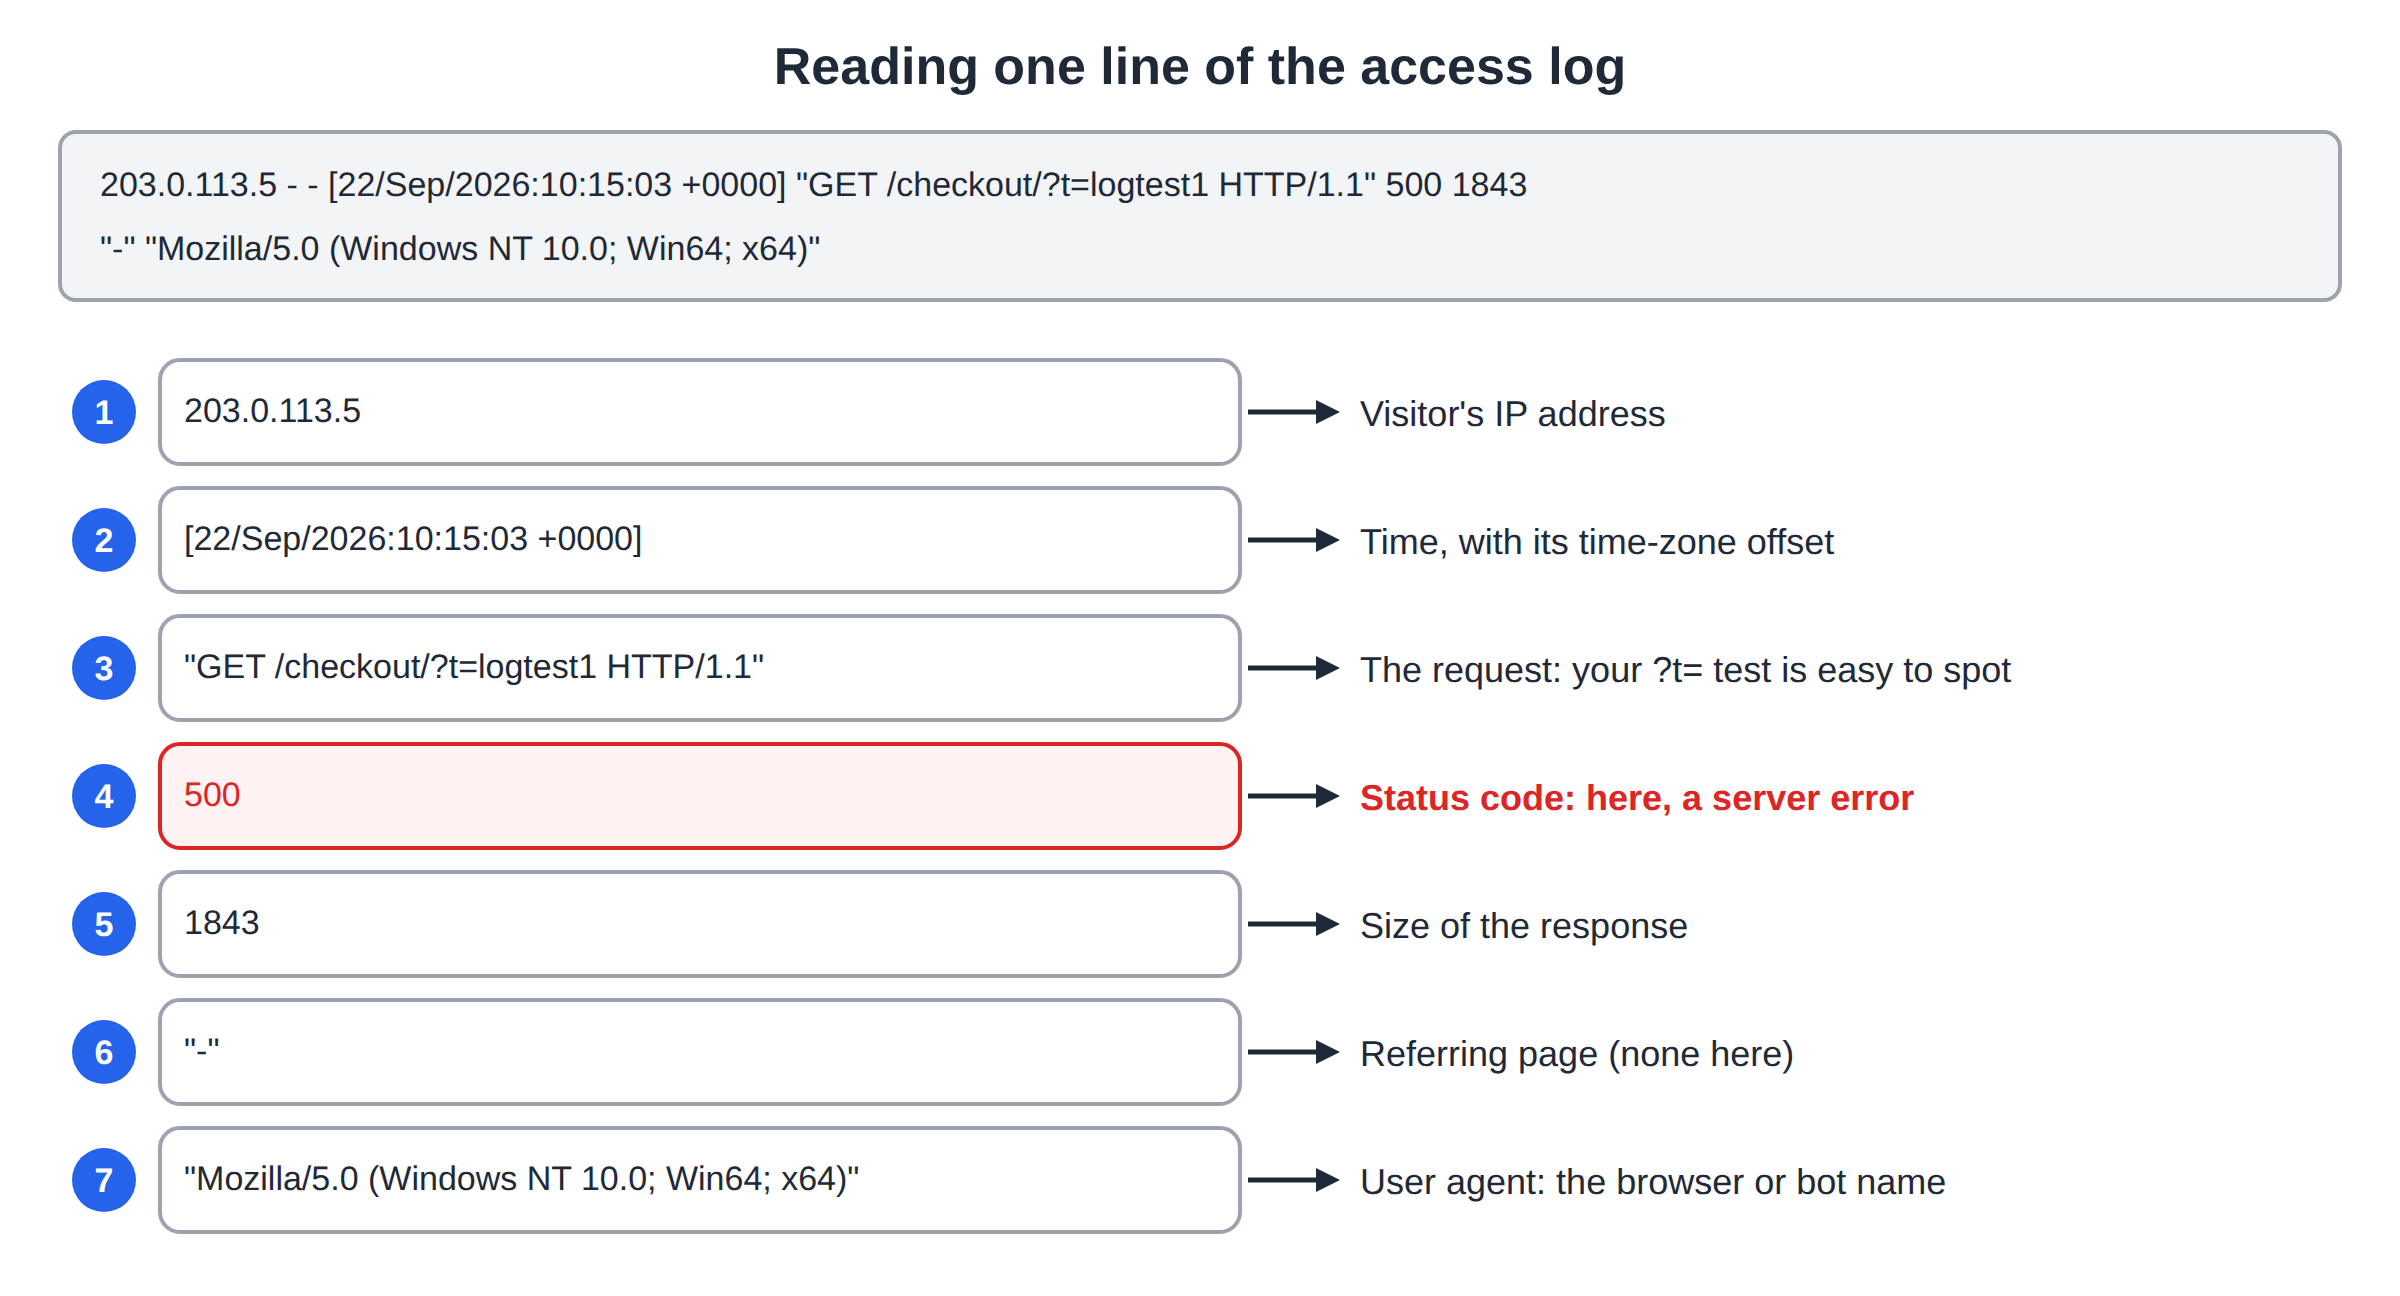
A typical line looks like this:
203.0.113.5 - - [22/Sep/2026:10:15:03 +0000] "GET /checkout/?t=logtest1 HTTP/1.1" 500 1843 "-" "Mozilla/5.0 (Windows NT 10.0; Win64; x64)"Left to right: the visitor's IP, the time with its time-zone offset, the request, the status code (here 500), the response size, the referring page and the user agent.
On our cPanel servers, pages served from the nginx cache never reach Apache, so they are missing from the access log and from Metrics › Visitors, which reads it. Use it to find errors and suspicious requests, not to count visitors.
5. How to read an error line
Most error lines have the same parts. Here is an Apache error from a bad .htaccess line:
[Mon Sep 22 10:15:03.412345 2026] [core:alert] [pid 48211] [client 203.0.113.5:51234] /home/youruser/public_html/.htaccess: Invalid command 'php_value', perhaps misspelled or defined by a module not included in the server configurationAnd a PHP error from an error_log file:
[22-Sep-2026 10:15:03 UTC] PHP Fatal error: Uncaught Error: Call to undefined function mysql_connect() in /home/youruser/public_html/includes/db.php:12Four things matter in every line:
- The time. It follows the server's clock, which may not be Indian Standard Time. Your own
?t=test request is the easiest way to line the two up. - The severity.
Fatal errorandalertstopped the page.Warning,NoticeandDeprecatedrarely cause an error page. - The file and line number.
db.php:12means line 12 of that file. A path insidewp-content/plugins/orwp-content/themes/names the plugin or theme. - The message. Section 6 lists the common ones.
PHP errors can also appear in Metrics › Errors inside a line containing Got error 'PHP message: …'. The part after PHP message: is PHP's own error.
6. Common messages and what they mean
| The log says | What it means | What to do |
|---|---|---|
| Invalid command 'php_value' or 'php_flag' | PHP settings written into .htaccess | Remove the line; set the value in your control panel |
| Option ... not allowed here | A disallowed Options line (DirectAdmin) | Use an allowed value or remove it |
| Request exceeded the limit of 10 internal redirects | A rewrite rule loops on its own target | Fix the RewriteCond or RewriteRule |
| Permission denied | A file or folder permission is wrong | Use 644 for files and 755 for folders |
| client denied by server configuration | A Deny or Require rule refused the request | Check the .htaccess in that folder |
| ModSecurity: Access denied | A security rule blocked the request | Send support the URL, time and rule id |
| Allowed memory size of ... bytes exhausted | One script reached PHP's memory_limit | Raise memory_limit in the panel, or fix the script |
| Call to undefined function | A missing PHP extension, or old code on a newer PHP | Enable the extension or update the code |
| End of script output before headers | The script crashed or was stopped before it answered | Check the PHP error_log and resource faults |
php_valueandphp_flagalways give a 500 on our Linux shared servers. None of them run PHP as an Apache module, so Apache doesn't recognise these lines. Set PHP values in your control panel: see How to fix "Allowed memory size exhausted" PHP errors.- DirectAdmin
Optionsmay use only Indexes, IncludesNOEXEC, MultiViews, SymLinksIfOwnerMatch, FollowSymLinks or None. Any other value gives a 500. - Never set 777 to cure Permission denied. It is unsafe and can cause a 500 on its own.
- 404s are usually in the access log, not the error log: look for status
404in the Raw Access file.
For the other status codes, see the 500 error guide, the 403 Forbidden guide and the "Resource Limit Is Reached" guide.
7. DirectAdmin and Webuzo
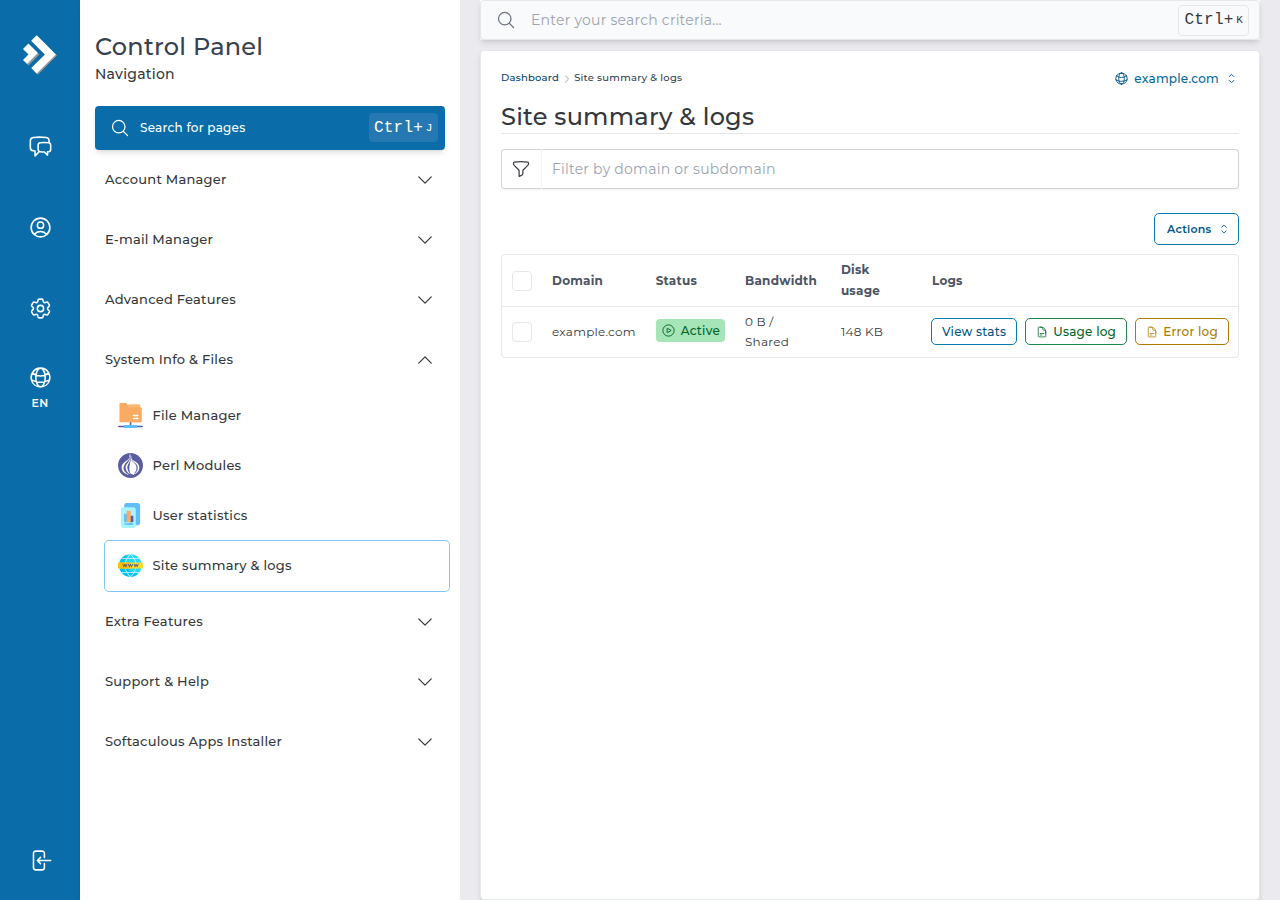
DirectAdmin keeps a separate error log and access log for each domain: open System Info & Files › Site summary & logs and use the domain's Error log or Usage log (access log) button. DirectAdmin normally stores older, compressed monthly logs in domains/yourdomain.com/logs in your home folder, next to public_html, which you can reach with the DirectAdmin File Manager. The PHP error_log file next to your script works the same way as on cPanel.
Webuzo shows errors on its Error Log page; find it with the search box at the top of the Webuzo panel.
On either panel, if you can't find the log you need, open a ticket with the page, the time and what you were doing. We will read the logs for your account and send you the relevant lines.
8. Searching a log quickly
Download the log or the error_log file and search it instead of scrolling. On Linux, macOS or Windows with WSL:
# Only the fatal PHP errors
grep "Fatal" error_log

# The last 50 lines, newest at the bottom
tail -n 50 error_log

# Requests that got a 500, from a compressed access log
zcat yourdomain.com-ssl_log.gz | awk '$9 == 500' | tail -n 20
If your account has SSH access, the same commands work on the server, and tail -f error_log shows new lines as you reload the page. Without SSH, File Manager and a downloaded copy do the same job.
9. Good log habits
- Turn debugging off when you are done. WordPress's
WP_DEBUG_LOGwrites towp-content/debug.log, which anyone can download if they know the address. Turn it off and delete the file after testing. - Never show errors to visitors on a live site. Displayed errors reveal file paths and code. Log them instead.
- Fix warnings that repeat, and check Metrics › Errors after every plugin update, PHP version change or
.htaccessedit. A notice on every page load can grow anerror_loguntil it fills your disk.
10. When to ask us, and where Domain India hosting fits
Open a ticket if the log names a file you can't change, shows a ModSecurity block, or can't be found. Include:
- the exact URL and the time of the error, with time zone;
- the log line you found, copied as text rather than as a screenshot;
- what changed just before it started.
Support is on 24/7 live chat, and tickets get a first response within 15 minutes; how long a fix takes depends on the issue. There is no phone support. Please don't send passwords in a ticket.
Domain India Linux shared hosting runs Apache, and cPanel gives you Metrics › Errors, Raw Access and Resource Usage, so you can read your own logs and faults.
- 50 GB NVMe SSD Storage
- 100 GB Monthly Bandwidth
- 5 Websites
- 50 Email Accounts
The price on the card is live and excludes 18% GST. If your site has outgrown shared hosting, a VPS gives you full access to every server log.
Where do I find the error log in cPanel?
Log in to cPanel and open Metrics › Errors. It lists the most recent web server errors for your account, newest first. PHP errors are often written to a separate file called error_log in the same folder as the script that failed, which you can open in File Manager.
What is the error_log file in my public_html folder?
It is where PHP writes errors from scripts in that folder. Each folder with a failing script can have its own error_log file, for example public_html/error_log or public_html/wp-admin/error_log. The newest lines are at the bottom. You can delete it once the cause is fixed, and PHP creates a new one if an error happens again.
How do I download my website's access logs in cPanel?
Open Metrics › Raw Access in cPanel and download the log for your domain. It is a compressed .gz file that you can open with any archive tool and read in a text editor. Each line shows the visitor's IP, the time, the page requested, the status code and the browser or bot.
Why is my error not showing in the log?
On Domain India cPanel servers, a caching proxy can serve a stored copy of a page for up to 120 minutes, and a cached request never reaches the web server, so it leaves no log line. Reload the page with a unique query string such as ?t=test1 and check again. Also check the error_log file in the script's folder, because PHP errors are often written there instead.
Where are the error logs in DirectAdmin?
DirectAdmin keeps an error log and an access log for each domain, shown under System Info & Files › Site summary & logs, and normally keeps older monthly archives in domains/yourdomain.com/logs in your home folder. If you can't find them, open a support ticket and we will read the logs for you.
Ready to find the cause? Start with Metrics › Errors and your error_log file, then use the 500 error guide or the 403 guide to fix what they point to, or open a ticket with the URL, the time and the log line.
Send us the page address, the time of the error and the log line you found, and we will read your account's logs with you.
Open a support ticket