Your control panel keeps several records of what your site is doing: resource use, visitors and errors. Each answers a different question, and one of them shows only your most recent requests, not a full history. This guide shows which to read, and when.
For a step-by-step walkthrough of the usage page and what each fault means, see How to check your hosting resource usage.
On cPanel, Metrics › Resource Usage shows CPU, memory, entry processes, I/O and processes over time, with a Faults column for each time your account hit a limit. Metrics › Visitors is a quick view of the most recent requests, not a full history. For request counts over a day or longer, use the access logs from Metrics › Raw Access, and read Metrics › Errors for recent error messages.
1. Which tool answers which question
| Question | Where to look (cPanel) | Good for |
|---|---|---|
| Is my account hitting its limits? | Metrics › Resource Usage | Faults, usage history, which resource |
| Who visited just now? | Metrics › Visitors | A quick look at the most recent requests; not a full history |
| How many requests, from whom, for what? | Metrics › Raw Access | Full access logs to count by IP, URL and bot name |
| What broke? | Metrics › Errors | Recent error-log entries |
| How much disk am I using? | Files › Disk Usage | Finding large folders |
DirectAdmin and Webuzo. In DirectAdmin, the Resource Usage page shows limits and faults (type it in the Search for pages box at the top of the DirectAdmin menu, or press Ctrl+J), and System Info & Files › Site summary & logs has each domain's View stats, Usage log (access log) and Error log. In Webuzo, the Bandwidth, Disk Usage and Error Log pages show usage and errors; find them with the search box at the top of the Webuzo panel. For anything else, open a ticket and we will read your account's usage and logs for you.
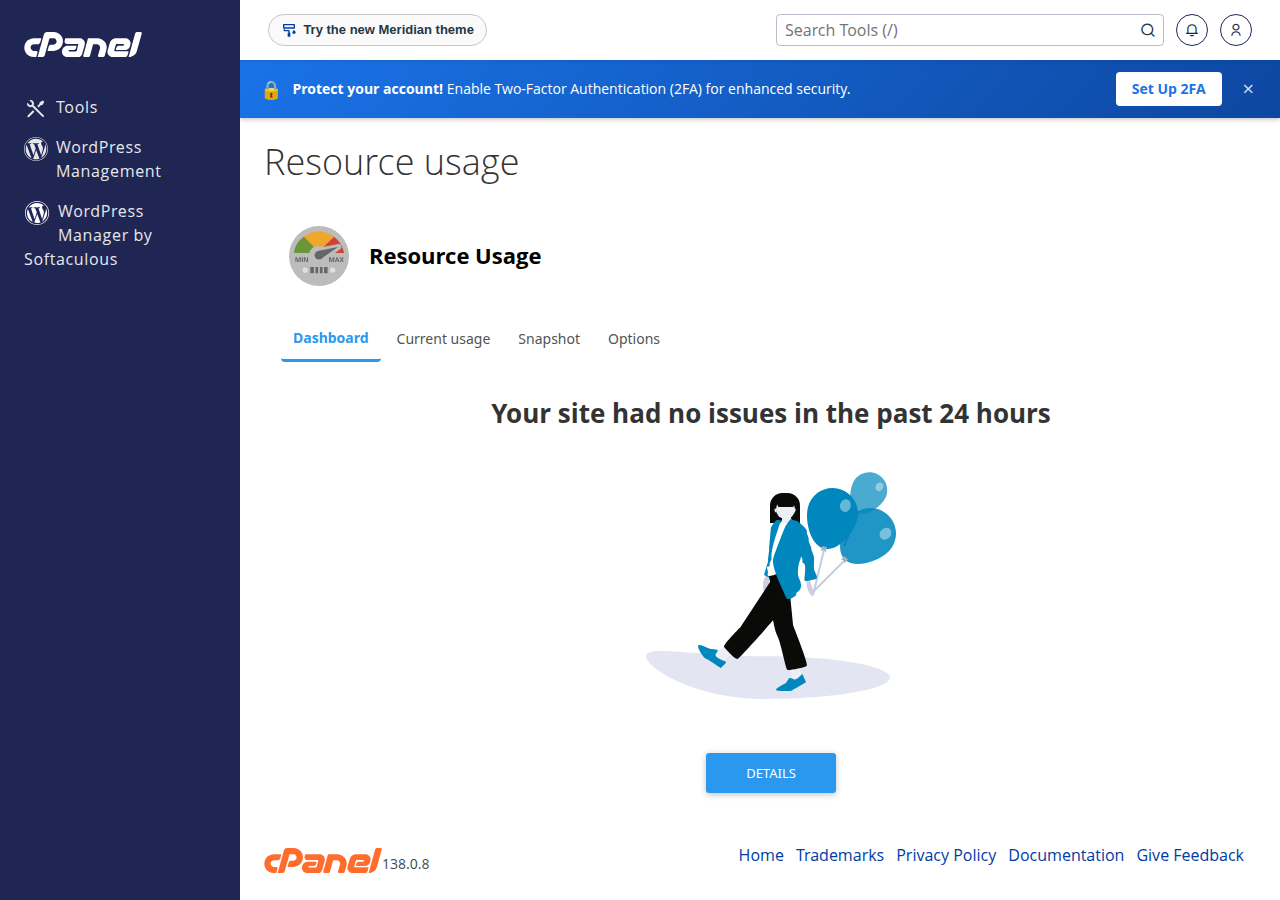
2. Resource Usage: your account's limits
Domain India shared hosting runs on CloudLinux (measured on our cPanel and DirectAdmin servers, 20 September 2026), which gives every account its own share of CPU, memory, disk activity and simultaneous PHP requests. Resource Usage is where you see that share being used.
- Pick the day or week when the problem happened, not only the current moment.
- Read the Faults column. Any number above zero means your account hit that limit. Entry-process faults show visitors a "Resource Limit Is Reached" (508) error; memory and process faults cause 500 or 503 errors; CPU and I/O faults slow the site down.
What each limit means is explained in Understanding hosting resource limits.
3. Visitors shows recent requests, not your full history
On our cPanel servers, nginx sits in front of the Apache web server and keeps a cached copy of successful pages and redirects for up to 120 minutes. Visitors and AWStats read the nginx and Apache logs together, so requests nginx answered from its cache are counted there too. What Visitors does not give you is history: it lists only the most recent requests (at most 1,000), so on a busy site it may cover only the last few minutes or hours.
When nginx answers a request from its cache, the request never reaches Apache, so the Apache log for your domain on its own can hold only a small fraction of your traffic. Before deciding that "hardly anyone visits", or that a bot flood is not happening, include the nginx logs. The monthly archives in the logs folder of your home directory include files whose names end in _NGINX, which record the requests nginx answered.
The cache has two more effects worth knowing. If a page changed and you still see the old version, add ?t= and any text to the end of the URL to fetch a fresh copy. And while Apache is returning a 500 error, nginx can keep serving the last good copy of a cached page, so a site that looks fine to you may be failing on pages that were not cached. Test with ?t= before deciding the site is healthy.
4. Raw Access logs: the complete picture
Download the logs for the day you care about from Metrics › Raw Access, then count requests by IP address, URL and user agent (the browser or bot name). A few IPs or one bot name making most requests is a bot problem; most requests going to wp-login.php or xmlrpc.php is a login attack. With SSH, or on your own computer against a downloaded log:
# Top 20 IP addresses
zcat -f ~/logs/yourdomain.com-ssl_log* | awk '{print $1}' | sort | uniq -c | sort -rn | head -20
More commands are in the full "Resource Limit Is Reached" guide. For error logs, see Reviewing error logs in cPanel and DirectAdmin.
5. A simple monitoring routine
- Once a week, open Resource Usageand check the Faults column for the past seven days.
- After any change,such as a new plugin, theme, campaign or payment integration, check Resource Usage again over the next busy period.
- When faults appear,note the times, then count the Raw Access logs for that window.
- Use an outside uptime monitorif you want an alert when your site stops responding. Resource Usage records what happened; it is not an alarm.
6. If you run a VPS
A VPS has no shared-hosting limits: it has its own vCPU, RAM and disk, and you monitor it from inside the server. Standard Linux tools cover the basics: top or htop for CPU and memory by process, free -h for memory, df -h for disk space, and your web server's access logs for traffic. See VPS servers for plans.
7. When the numbers say upgrade
Upgrade when faults continue after you have fixed the causes, or when genuine traffic has grown. An active cPanel or DirectAdmin plan can be upgraded at any time: open Hosting › My hosting, select your hosting service and choose Change plan. Pricing and details: Can I upgrade my web hosting package at any time?
Where can I see my website's resource usage in cPanel?
Open Metrics › Resource Usage in cPanel. It shows CPU, physical memory, entry processes, I/O and number of processes over time, with a Faults column that counts each time your account hit a limit.
Why does cPanel Visitors show fewer visits than I expect?
Visitors lists only your most recent requests (at most 1,000), not a full history, so it cannot show a whole day's traffic on a busy site. It does include requests that nginx answered from its cache. For totals over a day or a month, use AWStats or download the access logs from Metrics › Raw Access.
How do I find out which bots are visiting my site?
Download your access logs from Metrics › Raw Access and count requests by user agent, the browser or bot name recorded with each request. One name or a few IP addresses making most requests points to a bot problem.
How do I get an alert when my site goes down?
Use an outside uptime monitoring service that checks your site every few minutes and emails you when it stops responding. Resource Usage in cPanel records faults for you to review later; it is not an alarm, so check it regularly as well.
Ready to check your site? Open Metrics › Resource Usage in cPanel, follow How to check your hosting resource usage, or open a ticket and we will read your usage and logs with you.
Tell us the dates and the page you are worried about, and we will read your account's usage and access logs with you.
Open a support ticket