When WordPress shows a white screen, "There has been a critical error on this website" or a 500 error, its own debug log usually names the plugin, theme or file that failed. This guide shows how to turn that log on safely from cPanel's File Manager, where to read it, and how to switch it off again without leaving your site exposed.
Open wp-config.php in File Manager and, above the line that begins /* That's all, stop editing!, set WP_DEBUG to true, WP_DEBUG_LOG to true and WP_DEBUG_DISPLAY to false. Reload the failing page and read wp-content/debug.log. That file can be downloaded by anyone who knows its address, so turn debugging off and delete the log as soon as you have the answer.
1. Check the server log first
Many errors are already in the server's logs: in cPanel, open Metrics › Errors, and look for an error_log file in public_html (or in public_html/wp-admin if only the admin area fails). If a line there names a file inside wp-content/plugins/ or wp-content/themes/, you already know the culprit. See Reviewing error logs in cPanel and DirectAdmin.
Turn on the WordPress log when the server log is empty or unclear.
2. What the three settings do
| Setting | Set it to | What it does |
|---|---|---|
| WP_DEBUG | true | Switches WordPress into debug mode, so PHP errors, warnings and notices are reported |
| WP_DEBUG_LOG | true | Writes those messages to wp-content/debug.log |
| WP_DEBUG_DISPLAY | false | Keeps the messages off the web page, so visitors never see file paths or code |
With WP_DEBUG_DISPLAY set to false, WordPress also switches PHP's display_errors off for you, so the extra @ini_set( 'display_errors', 0 ); line found in older guides is not needed.
3. Turn debugging on in wp-config.php
- Log in to cPanel.Use the login button on your hosting service in the client area, or see How to login to cPanel.
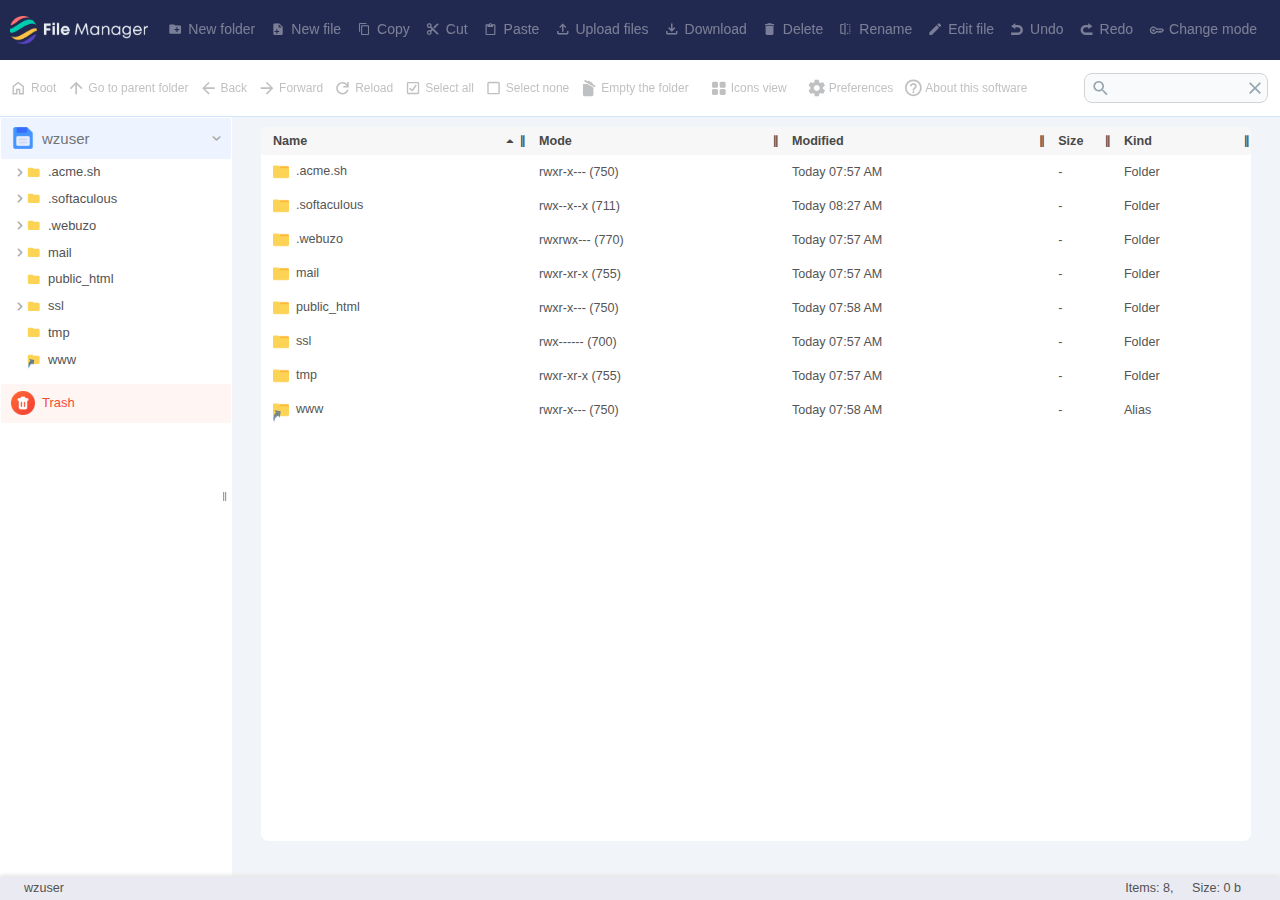
- Open File Managerfrom the Files section and go to your WordPress folder. That is usually
public_html, or a subfolder of it if WordPress runs on an addon domain or in a folder such as/blog. See How do I use the File Manager. - Save a copy of wp-config.php.Right-click it and choose Copy, naming the copy something like
wp-config-backup.php, so you can undo any mistake. - Edit wp-config.php.Right-click it and choose Edit. Search the file for
WP_DEBUG: most installations already have a line such asdefine( 'WP_DEBUG', false );. - Set the three values.Change the existing line to
trueand add the other two below it, all above the line that begins/* That's all, stop editing!. Never define the same constant twice. - Save the file,then reload the page that fails, adding a test parameter such as
?t=debug1to the address.
The finished block looks like this:
define( 'WP_DEBUG', true );
define( 'WP_DEBUG_LOG', true );
define( 'WP_DEBUG_DISPLAY', false );Our cPanel servers run nginx in front of Apache as a caching proxy, and it can keep serving a stored copy of a page for up to 120 minutes (measured 22 September 2026). A cached request never reaches WordPress, so nothing is written to the log. Add ?t= with a new value every time you reload.
4. Read debug.log
Go to wp-content in File Manager and open debug.log. The newest lines are at the bottom. A typical entry looks like this:
[23-Sep-2026 10:15:03 UTC] PHP Fatal error: Uncaught Error: Call to undefined function get_field() in /home/youruser/public_html/wp-content/themes/mytheme/single.php:14Here, line 14 of a theme file calls a function from a plugin that is no longer active. Fatal error lines stop the page; Warning, Notice and Deprecated lines usually don't. No debug.log at all means the request came from the cache or the error happens before WordPress loads: go back to the server log.
For what to do once you know the cause (disable the plugin, switch the theme, fix .htaccess), follow Troubleshooting a 500 error in WordPress using cPanel.
5. Keep debug.log private
By default debug.log sits inside your website, at https://yourdomain.com/wp-content/debug.log. Anyone who knows that address can download it, and bots look for it. It can reveal file paths, plugin and theme names, and other details that help an attacker.
You have two safe options:
- Keep the session short. Turn debugging on, reproduce the error, read the log, then switch it off and delete the file (section 6). This is enough for most fixes.
- Write the log outside the website.
WP_DEBUG_LOGalso accepts a file path instead oftrue. Point it at your home folder, abovepublic_html, where no browser can reach it:
define( 'WP_DEBUG_LOG', '/home/youruser/wp-debug.log' );Replace youruser with your hosting username, which is shown on the Access tab of your hosting service in the client area. The file then appears in the top level of File Manager instead of in wp-content.
6. Turn debugging off when you are done
- Edit wp-config.php againand set
WP_DEBUGback tofalse. You can leave the other two lines in place; they do nothing whileWP_DEBUGisfalse. - Delete debug.logfrom
wp-content(or from your home folder, if you moved it). - Check the address.Open
https://yourdomain.com/wp-content/debug.log?t=check1; it should now return "not found". - Delete wp-config-backup.phponce the site works.
A forgotten log keeps growing, uses your disk space and stays downloadable. See Why and how your WordPress website gets hacked.
7. DirectAdmin and Webuzo
The settings live in WordPress, so they are the same on every panel. On DirectAdmin, your site's files are in domains/yourdomain.com/public_html in your home folder; open them with the DirectAdmin File Manager. On Webuzo, use the panel's file manager or an FTP client. If you can't find wp-config.php, open a ticket and tell us the site address.
8. When to ask us
Open a ticket if the log points to a file you can't change or no log appears at all. Include the page address, the time and the log line, copied as text, and no passwords. Support is on 24/7 live chat, and tickets get a first response within 15 minutes; fixes take as long as the problem needs. There is no phone support.
Domain India cPanel hosting puts File Manager, Metrics › Errors and WordPress tools in one panel, so you can do all of this yourself.
- 50 GB NVMe SSD Storage
- 100 GB Monthly Bandwidth
- 5 Websites
- 50 Email Accounts
The price on the card is live and excludes 18% GST.
How do I enable debugging in WordPress?
Edit wp-config.php in your WordPress folder and, above the line that begins "That's all, stop editing!", set WP_DEBUG to true, WP_DEBUG_LOG to true and WP_DEBUG_DISPLAY to false. Reload the failing page, then read the errors in wp-content/debug.log.
Where is the WordPress debug log?
When WP_DEBUG and WP_DEBUG_LOG are both true, WordPress writes errors to wp-content/debug.log inside your WordPress folder. If you set WP_DEBUG_LOG to a file path instead of true, the log is written to that path.
Is it safe to leave WP_DEBUG on?
No. The default debug.log can be downloaded by anyone who knows its address, it can reveal file paths and plugin details, and it grows with every warning. Turn WP_DEBUG back to false and delete debug.log as soon as you have found the error.
Why is my debug.log file empty or missing?
Either the page came from a cache and never reached WordPress, or the error happens before WordPress loads. On Domain India cPanel servers, reload with a unique query string such as ?t=test1, and check the server's error log in Metrics › Errors and the error_log file in your WordPress folder.
Should I use WP_DEBUG_DISPLAY true on a live site?
No. Displaying errors shows file paths and code to every visitor. Keep WP_DEBUG_DISPLAY false and read the errors in the log file instead.
Ready to find the error? Turn on the log, reload with ?t=, and use the WordPress 500 error guide to fix what it names, or open a support ticket with the page address, the time and the log line.
Send us the page address, the time of the error and the log line you found, and we will look at your account's logs with you.
Open a support ticket