When a Windows-hosted website fails, the page your visitors see rarely says why. The reason is almost always written in a log: the web server's record of each request, your application's own error output, or a startup log. This guide shows where to find the logs for your site in Plesk on Domain India Windows hosting, how to read them, and how to turn on extra detail safely while you debug.
In Plesk, open Websites & Domains, pick your domain and choose Logs to see recent access and error entries, with filters by type and date. The raw log files are also in the logs folder of your subscription, which you can download with the File Manager or FTP. For ASP.NET Core startup failures, turn on the stdout log in web.config; for .NET Framework, set customErrors to Off briefly. Always switch detailed errors off again once you have the answer.
1. Open the logs in Plesk
- Sign in to Plesk.In the client area, open your hosting services, pick the Windows service and click the Plesk button. See how to log in to Plesk if needed.
- Pick your domainunder Websites & Domains.
- Open Logs.Plesk's log browser shows the newest entries first. If you can't see it, type "logs" into the search box at the top of Plesk.
- Filter.Narrow by log type, date range or a word such as a page name, then reproduce the problem and refresh to see the new lines.
The log files themselves live in a logs folder beside httpdocs in your subscription. Download them with the Plesk File Manager or with FTP on port 21 (explicit TLS) when you want to search them in a text editor. Large files open more easily in an editor such as VS Code or Notepad++ than in a browser.
2. Which log answers which question
| Log | What it records | Use it to answer |
|---|---|---|
| Access log | Every request: time, URL, status code, time taken, client IP | Which requests fail, how often, since when |
| Error log, if Plesk lists one | Errors recorded for the site outside your code | Why a request failed before your app handled it |
| ASP.NET Core stdout log | What your app printed while starting and running | Why an ASP.NET Core app won't start (500.30, 503) |
| Your application's log | Whatever your code or framework writes | The exception behind a 500 inside your app |
| PHP errors | PHP warnings and fatal errors, if your site uses PHP | Why a PHP page is blank or failing |
Server-wide logs, such as the Windows Event Log and mail server logs, are not available on shared hosting. If you need something from them, ask support to check for you.
3. Reading an IIS access log line
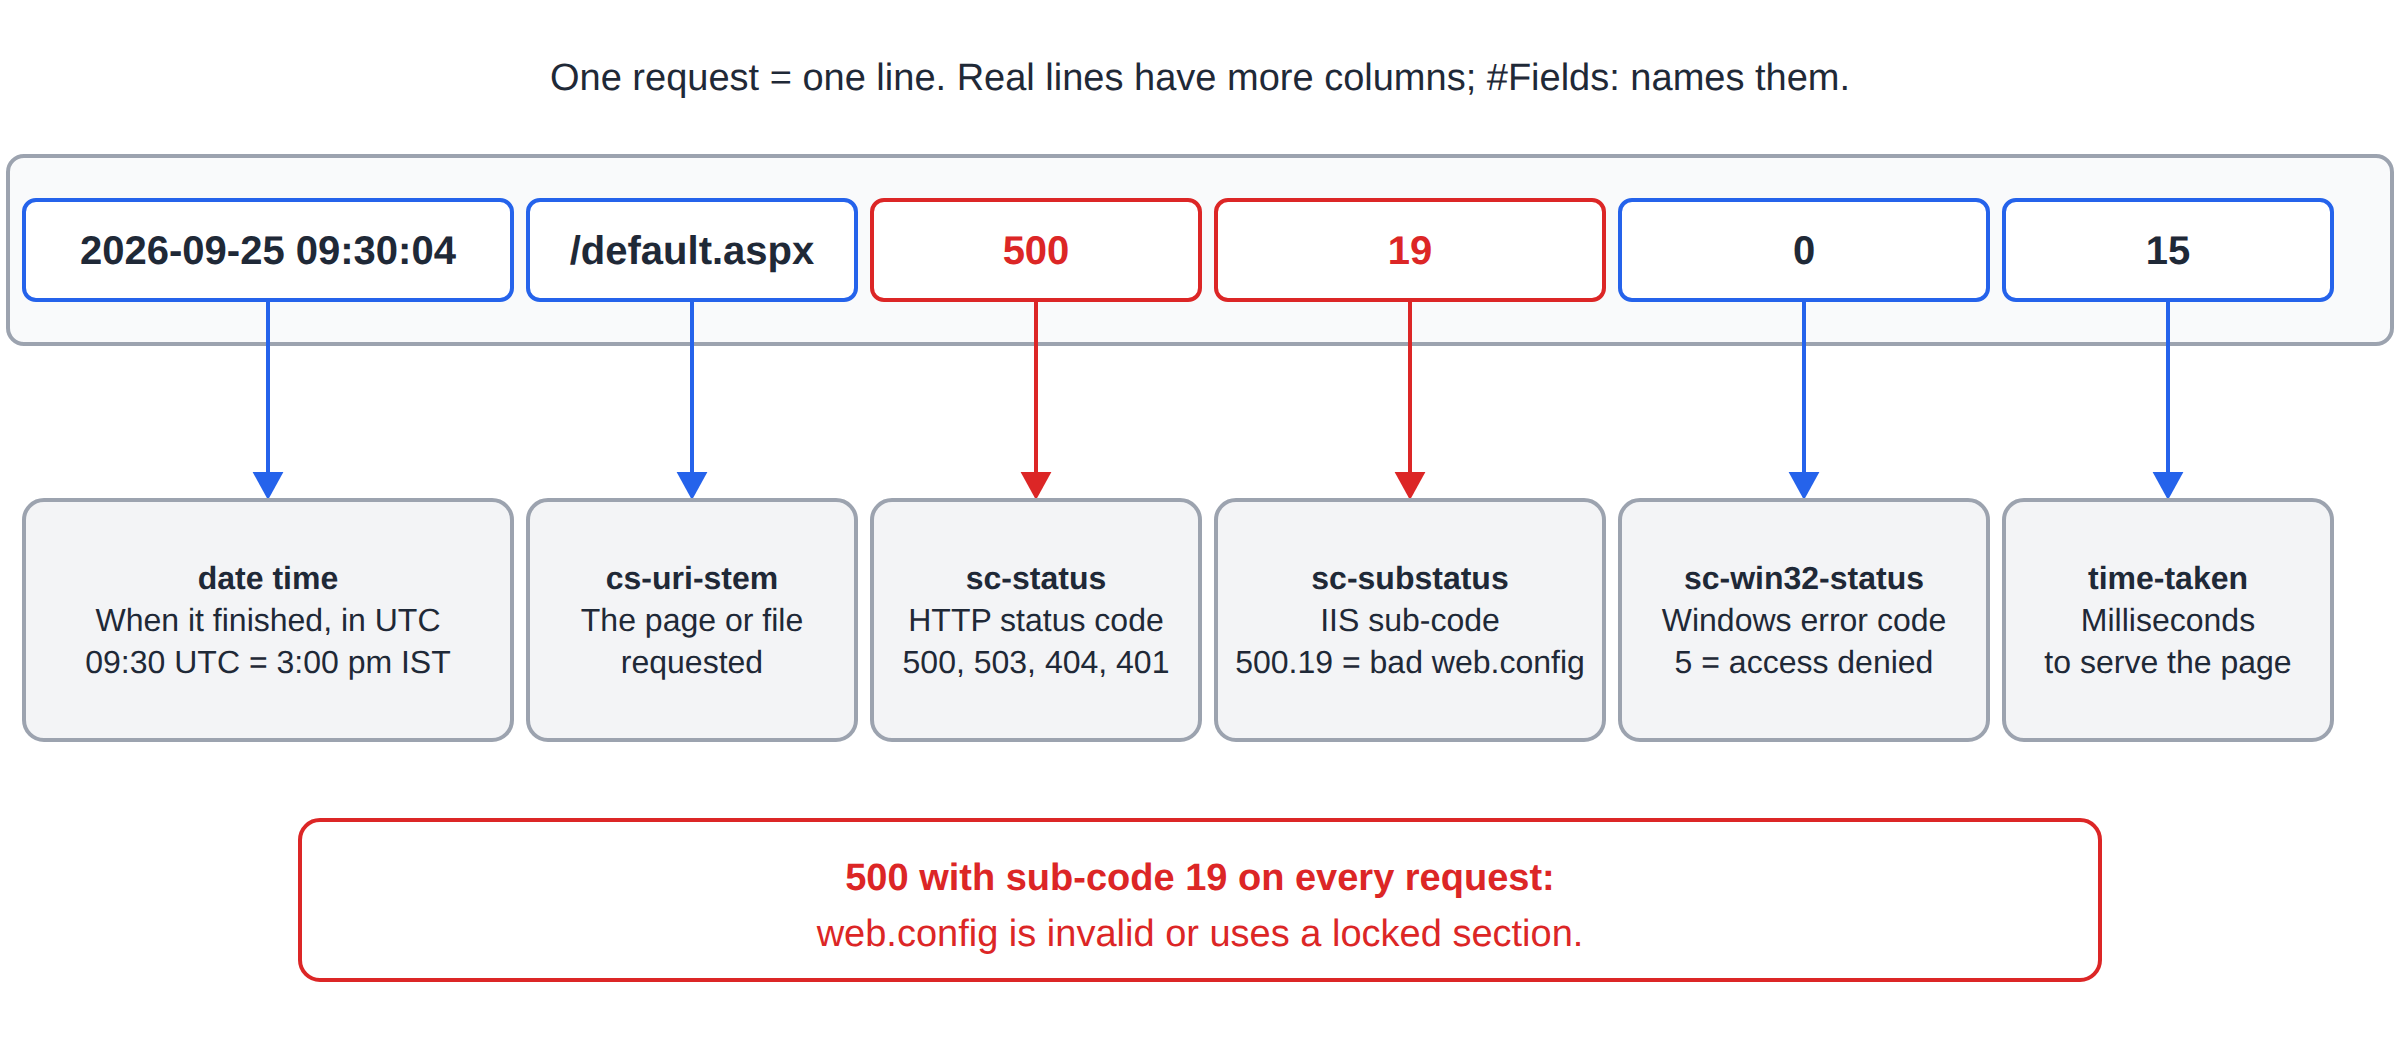
IIS writes one line per request in W3C format. The header line at the top of each file (starting #Fields:) names the columns. The ones that matter most:
| Field | Meaning | What to look for |
|---|---|---|
| date time | When the request finished, in UTC | Match against when the problem started |
| cs-uri-stem | The page or file requested | Which URL fails |
| sc-status | The HTTP status code | 500s, 503s, 404s, 401s |
| sc-substatus | The IIS sub-code | 500.19 means bad web.config, 404.7 a blocked file type |
| sc-win32-status | A Windows error code | 5 means access denied, 64 a dropped connection |
| time-taken | Milliseconds to serve | Slow pages |
IIS log times are in UTC. India is UTC+5:30, so a problem at 3:00 pm IST appears at 09:30 in the log.
4. Patterns worth recognising
- The same URL returning 500 again and again: an error in the code behind that page. Turn on detailed errors (section 5) and load the page yourself.
- Every request returning 503: the application pool has stopped or
app_offline.htmis present. See resolving 503 errors on IIS. - 500.19 on every request:
web.configis invalid or uses a section that is locked on shared hosting. Restore the last working copy. - Many 404s for one URL: a broken link or a moved page. Fix the link or add a redirect.
- Many 401 or login POSTs from a few IPs: someone is guessing passwords. Use strong passwords and your application's login protection.
- Large time-taken on one page: a slow database query or external call on that page.
5. Turn on detailed errors while you debug
Detailed errors show the real exception, file names and sometimes connection details to anyone who loads the page. Turn them on, reproduce the error, then turn them off.
ASP.NET Core. In web.config, set stdoutLogEnabled="true" on the aspNetCore element, create an empty logs folder inside httpdocs, reload the site, and read the newest file in that folder:
<aspNetCore processPath="dotnet" arguments=".\MyApp.dll"
            stdoutLogEnabled="true" stdoutLogFile=".\logs\stdout"
            hostingModel="inprocess" />
.NET Framework. Inside system.web:
<customErrors mode="Off" />IIS detailed error pages. Inside system.webServer:
<httpErrors errorMode="Detailed" />If adding httpErrors makes every page return 500.19, that section is locked on the server. Remove the line and rely on the application-level settings above.
PHP sites on Windows hosting. Check your domain's PHP settings in Plesk for display_errors and log_errors. Keep display_errors off on a live site and read the log instead.
WordPress. In wp-config.php:
define('WP_DEBUG', true);
define('WP_DEBUG_LOG', true);
define('WP_DEBUG_DISPLAY', false);
Errors then go to wp-content/debug.log. Delete that file and set WP_DEBUG back to false when you finish, because anyone can download it.
Leaving customErrors mode="Off", detailed IIS errors or the stdout log on after debugging exposes your code's internals to visitors, and the stdout log keeps growing with every restart. Set them back as soon as you have the error message.
6. Log size and disk space
Logs grow with every visit. Plesk rotates them, and if your Plesk shows a Log Rotation page for the domain you can choose how many old files to keep. Download anything you need before it rotates away. If your disk usage climbs, check the size of the logs folder and any debug.log or stdout files your app has written.
7. When to contact support
Contact support if:
- the logs show nothing at all for the time of the failure;
- the error points at the server rather than your site (every site failing, a service not responding);
- you need information from the Windows Event Log or the mail logs;
- your application pool keeps stopping and you have no pool controls in Plesk.
Include your domain, the exact time (with time zone), the URL, and the log lines you found. For a table of the common errors and their quick fixes, see common Plesk errors and fixes, and for the rest of the panel read the Plesk Windows hosting guide.
Where are the logs for my website in Plesk?
Open Websites and Domains in Plesk, pick your domain and choose Logs. The raw files are also in the logs folder of your subscription, next to httpdocs, and you can download them with the File Manager or FTP.
Why are the times in my IIS log different from my clock?
IIS writes log times in UTC. India Standard Time is five and a half hours ahead, so add 5:30 to the time in the log.
How do I see why my ASP.NET Core app won't start?
Set stdoutLogEnabled to true on the aspNetCore element in web.config, create an empty logs folder inside httpdocs, reload the site and read the newest file in that folder. Set it back to false afterwards.
Adding httpErrors errorMode Detailed gives a 500.19 error. Why?
That section of the IIS configuration is locked on the shared server, so web.config isn't allowed to change it. Remove the line and use customErrors mode Off or the ASP.NET Core stdout log instead.
Can I see the Windows Event Log or the mail server logs?
Not on shared hosting; those logs are on the server and cover every customer. Ask support, with your domain and the time of the problem, and they will check them for you.
Is it safe to leave detailed errors switched on?
No. Detailed errors show your code's internals to every visitor. Turn them on only while you reproduce a problem, then switch them off.
Ready to get to the bottom of an error? If the logs don't explain it, open a support ticket with the lines you found. Support is on 24/7 live chat, and tickets get a first response within 15 minutes.
Send us your domain, the time and the log lines, and we'll help you find the cause.
Open a ticket